

New Normal
When meteorologists and the WDRB weather team mentions an "average" temperature, or say how it's much "warmer than normal", do you know what these conditions are compared to? The answer is weather from the past using climate normals. These "normals" are based on 30-year average temperatures and precipitation to help standardize our understanding of weather, by location and time of year.
U.S. Climate Normals are designed—and best-suited for—better understanding what is happening today. Rather than assess long-term climate trends, Normals reflect the impacts of the changing climate on our day-to-day weather experience. Normals are not merely averages of raw data. Thirty years of U.S. weather station observations are compiled, checked for quality, compared to surrounding stations, filled in for missing periods, and used to calculate not only averages, but many other measures. These then provide a basis for comparisons of temperature, precipitation, and other variables to today’s observations.
Supplemental Normals for the 15-year period 2006–20 are being released simultaneously with conventional 30-year Normals for users who require information for periods closer to the present. This will be a new 30-year dataset that expands from 1991 to 2020. These new climate Normals will be used for the next 10 years, until the next ones are released in 2030.
Why update U.S. Climate Normals?
Member states of the World Meteorological Organization (WMO) are required to calculate their country’s normals at ten-year intervals. Countries follow recommendations by the WMO, which provides a framework for international cooperation among meteorologists, climatologists, and hydrologists.
The decadal update is the equivalent of the Census for those who use the data. It replaces the previous set of U.S. Normals, which cover all 50 states and U.S. territories such as Puerto Rico and Guam. NCEI and its predecessors have been the official source for U.S. Climate Normals since the 1950s. New data come from approximately 8,700 National Weather Service stations operated by NOAA, which include Automated System Observing Stations (ASOS) and Cooperative Observer Program (COOP) stations.
For the first time, Precipitation Normals have been created for more than 770 Snow Telemetry (SNOTEL) stations managed by the U.S. Department of Agriculture and for more than 5,400 citizen science observation stations from the Community Collaborative Rain, Hail, and Snow (CoCoRaHS) Network. Calculating and making available the new averages is a significant undertaking that requires months of preparation by a team of climate scientists, including NCEI partners from the Cooperative Institute for Satellite Earth System Studies (CISESS) and NOAA Regional Climate Centers (RCCs).
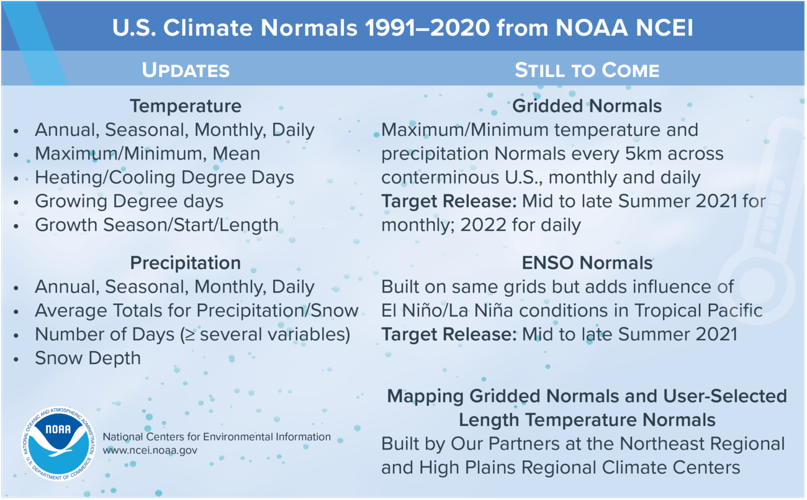
Normals provide information about national and localized average temperature and precipitation as well as other parameters, such as snowfall, heating and cooling degree days, frost and freeze dates, and growing degree days. Several new Normals will be introduced for the first time, including Seasonal Normals representative of different states of the El Niño/Southern Oscillation (ENSO) and High-resolution Gridded Normals, which are data that represent Climate Normals at 5 km intervals north and south across the contiguous U.S. to allow for easier calculations and mapping of climate averages and departures from normal. New Normals access tools will also be forthcoming from our RCC partners.

Comparing averages to weather observations, anyone interested in the conditions at specific locations can learn whether a variable is above, below, or near average. For instance, the average temperature during the February 2021 Arctic air cold outbreak in the Dallas–Fort Worth area was 42°F below normal on February 16, according to the 1991–2010 Normals.
Along with the National Weather Service (NWS) and meteorologists and forecasters in the private sector, the new Normals impact the work of numerous public and private stakeholders, including the energy and agricultural sectors of the American economy, building design, infrastructure, construction, and several governmental organizations, such as the USDA.
So what has changed?
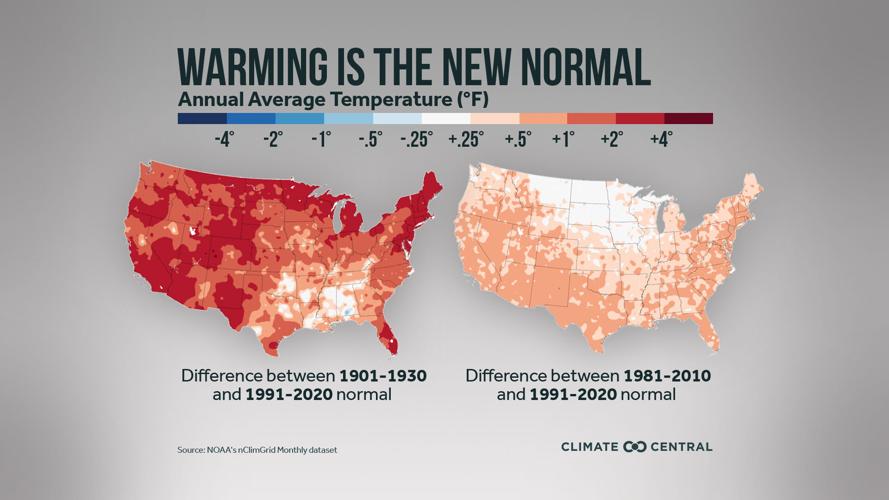
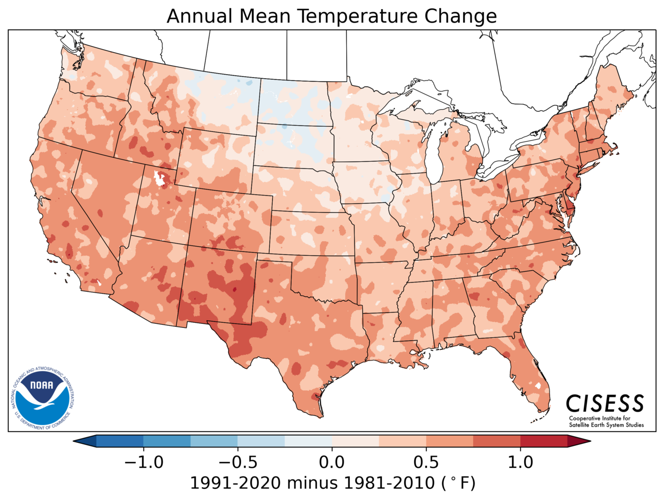
The first noticeable change is the shift in temperature averages. The 1981–2010 average temperature for the contiguous U.S. was 52.8°F while the new average temperature for the contiguous U.S. for 1991-2020 is 53.3°F. The new normals period, 1991-2020, is the warmest on record for the country, but warming is not ubiquitous across the contiguous U.S. in either geographic space or time of year. Changes vary from season-to-season and month-to-month.
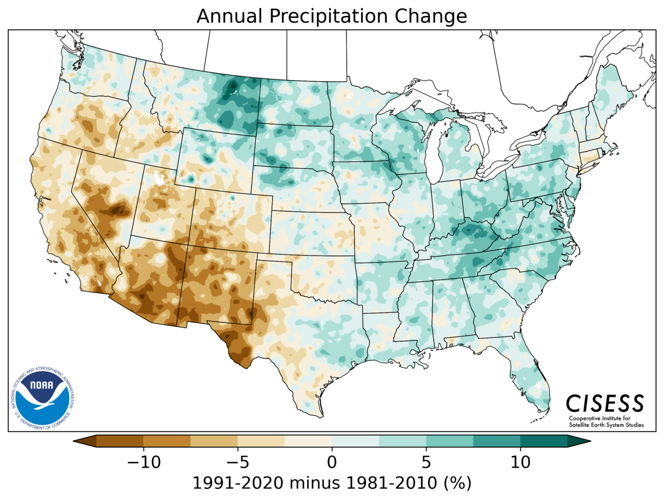
For instance, the north-central U.S. Temperature Normals—for those in the Northern Plains and Upper Midwest—have cooled from 1981–2010 to 1991–2020, especially in the spring. The South and Southwest are considerably warmer. Normals were also generally warmer across the West and along the East Coast.Precipitation-wise, the Southwest was drier; wetter averages emerged in the U.S. east of the Rocky Mountains, especially the Southeast in the spring.


In the transition to the new set of Normals, shifts in the relative frequency of above- and below-normal conditions will occur. Shifts will be most discernible in areas of the country undergoing substantial warming in the last decade, as experienced in the West and Florida. In those cases, comparisons of averages to current conditions will trigger below-normal temperature days more frequently. This does not mean that conditions are “colder” in the absolute sense; in actuality, higher averages have raised the bar for warmth.
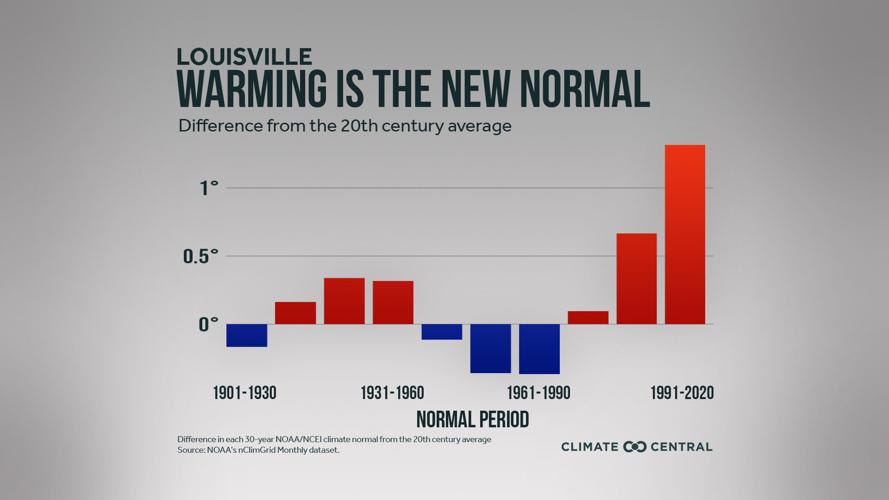
What about Louisville?
Louisville, just like the majority of the continental United States, has seen an increase in average temperatures compared to the last climate normal dates of 1981-2010. Louisville hasn't seen a decrease in average temperature over a 30-year period since the 1961-1990 climate Normals. In fact, average temperatures in the Louisville have climbed faster in this new dataset of 30-year climate Normals than ever before, beating out the last set of climate normals from 1981-2010.

Across the United States, the left image shows just how much temperatures have increased between the 1901-1930 climate Normals and the 1991-2020 new climate Normals. The right shows the difference between the previous 1981-2010 Normals versus the ones that were just released.

Climate Normals and Climate Change
Rather than track or define long-term trends or changes in climate, U.S. Normals are useful to understand present-day conditions. For climate monitoring activities at NCEI, longer periods are referenced. The monthly State of the Climate reports produced for the United States and globe use twentieth-century averages (1901–2000) as benchmarks and will continue to do so. The yearly Bulletin of the American Meteorological Society State of the Climate report also relies on longer periods of record.
Several reasons underlie the use of the twentieth-century averages for climate change monitoring:
- The 1901–2000 baseline offers more consistency as conditions change over time and is not subject to updates every 10 years.
- The period is an easy-to-understand range when discussing long-term climate change with non-technical audiences.
However, long-term trends from decade to decade can affect baseline “normal” weather conditions. For instance, the last decade includes the warmest seven years on record for the globe, according to NCEI.


