

Article from NOAA

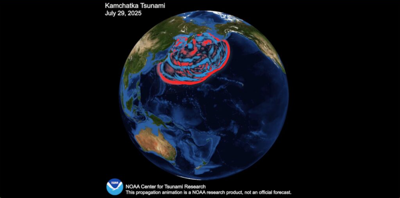
This image captures the modeled propagation of the tsunami wave generated by an 8.8 magnitude megathrust earthquake off the coast of Kamchatcka, Russia on July 29,2025.
When an 8.8 magnitude megathrust earthquake ripped along more than 360 miles of a subduction zone fault 85 miles offshore of Kamchatka, Russia, on July 29, 2025, scientists and emergency response officials had every reason to fear a major tsunami had been unleashed on the Pacific Ocean.
Twenty-six minutes later, tsunami waves racing outward from the epicenter at more than 400 miles per hour arrived at the first DART tsunami detection system, a moored buoy above a pressure sensor on the ocean floor that’s part of a network run by NOAA’s National Weather Service (NWS) through the National Data Buoy Center (NDBC). The most significant wave lifted the buoy almost 3 feet, the second-largest displacement ever recorded by the DART buoy system behind the 2011 Tohoku quake.
“We knew then that a catastrophic tsunami was propagating in the ocean,” said Vasily Titov, a senior tsunami modeler at NOAA’s Center for Tsunami Research (NCTR) based at NOAA’s Pacific Marine Environmental Laboratory (PMEL).
The two NWS Tsunami Warning Centers (TWC) are NOAA’s official source of tsunami information. The backbone of their forecast systems was developed over the past 30 years by the scientists at NCTR. When a quake strikes, researchers independently monitor seismic, water level sensor, and model outputs to confirm that they’re running properly. They can then use the information to improve new system features that are under development.
A complicated forecast
The Kamchatka earthquake’s location and intensity made tsunami forecasters’ job – predicting when and where the waves would strike land, how high they would be, and how much shoreline the waves would inundate – a challenging task, Titov said.
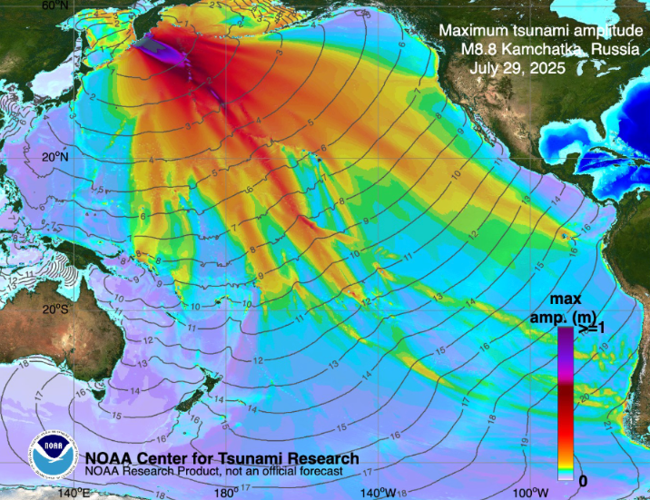
“We did get a bit lucky because the tsunami didn’t hit populated areas with its main force,” Titov said. Most of the energy of the tsunami went south of Hawaii.” Some of the biggest waves hit mostly unpopulated areas of Kamchatka, but very high wave run-ups along the steep cliffs along the coastline were observed, he added.

The energy of a tsunami does not move outward in all directions with the same momentum. That concept is illustrated here showing peak tsunami amplitudes based on DART data using NOAA forecast method with the MOST model. The inset box compares the model wave forecast at Midway Island to the observed event. Credit: PMEL’s NOAA Center for Tsunami Research.
“This is the first time that a tsunami of such an ocean-wide scale did not cause direct deaths,” said Titov, who has been studying tsunamis since the 1990s.“ All other tsunamis from similar strength earthquakes killed at least hundreds, often thousands of people. In light of this, the Kamchatka tsunami may be an important milestone. There are several factors that contributed, and the successful forecast is definitely one of them.”
“The model results were extremely accurate,” he said.
How does the forecast system work?
The tsunami forecasting system developed by NCTR scientists is built around two primary tools: a PMEL-designed Deep-ocean Assessment and Reporting of Tsunamis (DART) sensor that captures measurements of a tsunami wave as it passes, and a coupled numerical modeling capability, the Method of Splitting Tsunamis (MOST) model which predicts tsunami amplitudes and currents to guide tsunami warnings, advisories, and watches. Both components are combined into one forecast system named Short-term Inundation Forecast for Tsunamis (SIFT).
When a tsunami passes over a DART station, the bottom pressure recorder measures changes in water pressure, which are then transmitted to the surface buoy and relayed to tsunami warning centers via satellite. The DART data is combined with models to estimate the tsunami’s source, the area of the ocean floor displacement that generated the tsunami. This is done by comparing the observed wave characteristics, arrival time, height and period, with pre-computed tsunami simulations to produce the model source that best fits the DART data.
The estimated tsunami source is then used to initialize or update the MOST model, which simulates three processes of tsunami evolution: earthquake, transoceanic propagation, and inundation of dry land. The MOST model maps the forecast propagation of the tsunami wave across the ocean, suggesting its arrival time and height at numerous coastal locations. By incorporating DART data and refining the tsunami source, the MOST model can generate accurate and timely predictions of tsunami inundation and wave heights at specific coastal areas.
That detection and modeling process is combined into the SIFT system. SIFT uses the MOST model, earthquake information, real-time data from DART buoy networks, pre-computed scenarios from MOST, and real-time computations of high-resolution models to produce forecasts of arrival times, wave heights, current speeds, and potential inundation areas.
In essence, DART buoys capture actual measurements of wave energy, MOST provides the detailed tsunami simulations, and SIFT is the operational system that combines those simulations and real-time data for tsunami warning centers to analyze and forecast tsunami impacts to emergency managers.
How did the system perform?
Tsunami data from three of the DART buoys became available within about an hour of the earthquake. As more data came in and forecasters ran successive model iterations, it became apparent that the overall impact of tsunami waves on populated areas would be less severe than initially feared based on earthquake parameters alone. The first tsunami waves reached Alaska two hours after the earthquake, Hawaii six hours after the earthquake, Washington State eight hours after the earthquake, and nine hours to reach San Diego, California.
Measurements of the water displaced by the tsunami and its direction were also captured by new instruments on the Surface Water and Ocean Topography satellite, jointly operated by NASA and the French national space agency Centre national d’études spatiales. “That showed us that NOAA’s tsunami forecast was right on the money,” said Josh Willis, an oceanographer with NASA’s Jet Propulsion Laboratory.

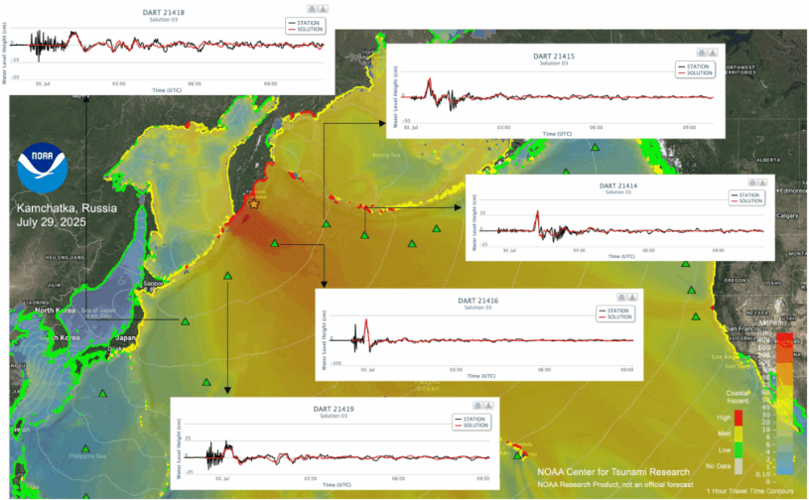
Summary of the tsunami propagation forecast in North Pacific showing predicted offshore peak amplitudes of propagating tsunami and potential coastal hazard levels in the background image. The insert plots show comparisons of this propagation model with 5 DART records that are closest to the tsunami source. The good comparison provides confidence in the accuracy of the forecast. Credit: NOAA Center for Tsunami Research.
Accurate tsunami forecasts not only help prepare vulnerable communities for impacts, PMEL Director Michelle McClure said, they also help avoid overestimates of impacts.
“An accurate forecasting system also gives emergency managers the confidence to cancel evacuation orders earlier,” said McClure. “Will it be safe in two hours or in 12 hours?”
What’s in the research pipeline?
NCTR Director Christopher Moore said scientists are working on a next-generation forecast system, termed the Common Analytic System (CAS). Its main objective is to produce faster, more accurate, actionable forecast systems for the NWS Tsunami Warning Centers. The CAS will enable the two warning centers to collaborate more seamlessly during a tsunami event, produce joint forecasts, and allow one to back up the other more easily in case of an outage.
To achieve that goal, the CAS system will employ large-scale automation with AI components seamlessly characterizing the tsunami from its source through numerical modeling, Moore said. This process will ensure the TWC forecasters can have practical tools to analyze, predict, and deliver helpful decision support to coastal emergency managers during an impactful tsunami event.
“The new system will save precious minutes during tsunami forecast and warning operations, allowing more time to make life-saving warning decisions,” he said.
For more information, contact Theo Stein, NOAA Communications: theo.stein@noaa.gov.
Watch the tsunami propagate across the Pacific Basin in this PMEL video: https://www.pmel.noaa.gov/public/pmel/videos/Kamchatka29Jul2025_global_animation.mp4.


