
First, when we forecast temperatures, we are forecasting for one specific location: the Louisville Muhammad Ali International Airport. That's where the official records are kept and most days the temperature shouldn't vary significantly across our area. When we do expect temperatures to vary more significantly across our area, we make note of that in the forecast.
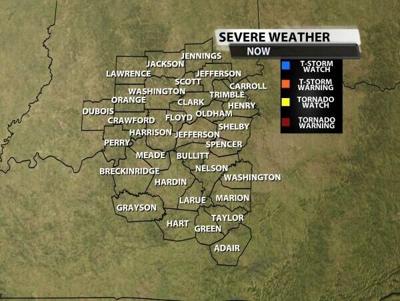
When the National Weather Service makes a spot forecast for Louisville, a 30% of rain means there is 30% confidence that rain will fall at that one location (the airport observing site). When the local TV station makes a forecast, it is for a larger geographic area, so before we go any farther we need to define "our area." Every television station covers a Designated Market Area - the people who live close enough to be able to pick up our broadcast signal and who we are responsible for informing about the weather. The map below shows 33 counties with black outlines; those counties make up our coverage area here at WDRB, and the list is fairly similar across all Louisville TV stations. There are a few counties along the edges that can either watch us or could get the signal from Lexington, Evansville, Bowling Green, Nashville, Cincinnati, or Indianapolis, so those are considered "fringe" counties and may show up differently between the Louisville TV stations.

Second, rain/snow/etc. (generally called precipitation - we will use precip for short) does vary much more across our area than temperatures do. If you are only forecasting for one specific point (like the airport), a 30% on the forecast would mean something different than if you were forecasting for 33 counties all at the same time. Precip also impacts you more than the temperature being five degrees higher or lower than the forecast you checked, so we try to communicate the chance of precip for the entire area instead of just focusing on the Louisville airport.
Now let's dive in: the "textbook" definition of POPs is coverage times confidence, but think of that as a bare minimum of factors to consider. Here are the things we think about when coming up with the POP you see in our 7-day forecast:
- how confident we are that precip will fall
- how much of our area it will cover
- how much of your day it will affect
- heavy rain vs. light rain
- how it will impact you (middle of the day vs. middle of the night)
- precip type (rain vs. snow)
Let's look at an example: if I am 100% confident 30% of our area will see rain, using this equation, that would be a 30% POP. A computer can figure that much out. But if I know this will be heavy rain and it will fall all day in that area, 30% is not a high enough POP to represent that. I would raise that to probably 60% and make a note that this is only for that specific part of the area.
Clear as mud, right? So much of forecasting the weather is a judgement call in the end, and the Probability of Precipitation is no different. There is no specific formula we plug numbers into that gives us all the answers. This is why we try to use words during our forecast like "isolated," "scattered," and "widespread," so that by the time you see the percentage on the 7-day forecast you already have a good idea of how widespread the precip will be. This is also why some TV stations are dropping POPs altogether and only using words on the 7-day forecast.
Another element to consider: your weather app. If the app you use is pulling raw model data (as opposed to being updated by a human meteorologist), the POP is NOT including all of those considerations. It is only looking at the confidence of you seeing rain at that moment. Say you're looking at the forecast for 8 PM in Elizabethtown, Kentucky, and the app tells you there's a 32% chance of rain. That's the model's confidence (based on different runs, ensemble members, etc.) that it will be raining in Etown at 8:00 PM. That's a spot forecast like we looked at above; it's not giving you the same information we are trying to give you on TV.
Here are a few other "fact or fiction" questions that come up a lot when we talk about the percentages:
- When forecasting snow, we use bigger percentages than if it were rain: FACT. Snow will cause more of an impact than rain will, so we use higher percentages to communicate that.
- There is direct benefit to us in using higher numbers to scare you: FICTION. If we throw big percentages out every time it rains or snows, you will stop trusting us and that benefits no one.
- The percentage will grow as we get closer to that event starting: FACT. As we become more certain about what will happen, we increase the percentage.


