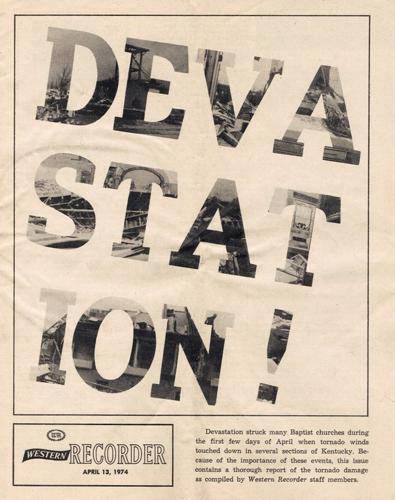


April 3, 1974: The Super Outbreak. A day that many of you today still remember vividly. The air felt hot and sticky and it was windy, all of which got worse through the afternoon. Some of you say it felt ominous, like something bad was coming.

Image from Western Recorder via National Weather Service
THE SETUP
The initial forecast for Wednesday, April 3rd, 1974 was windy and warm with a chance of showers, but as the morning unfolded, forecasters grew more concerned about the potential for strong thunderstorms. Just two days earlier, on April 1st, Campbellsburg was devastated by an F-3 tornado and Sandy Hook, Kentucky by an F-1.

On April 3rd, an almost tropical air mass here at the surface of the earth was a result of an unusually warm Gulf of Mexico and wind blowing just the right way from there into our region.

The upper level jet stream winds were moving at a very fast pace as were the lower level winds a few thousand feet above our heads. In between those two levels was a layer of dry air that had been pulled into our region from the desert southwest.

That dry layer of air acted as a "lid" and initially suppressed the development of storms. But it also allowed energy to build from daytime heating and that increasing moisture from the southeast. Eventually that energy became too much for the lid to suppress and it broke. That sudden release of energy created the explosive thunderstorms on Wednesday afternoon.

WHAT HAPPENED
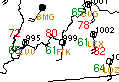
The slides below are in order during the course of the day. Notice the slight wind shift in Louisville. We call this "backing": the wind switched from south to southeast then back to southwest. This subtle change in wind direction in the course of six hours proves the environment is spinning and that made the difference in this event. This is a key factor we look for when diagnosing tornado potential in the atmosphere.
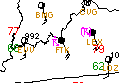
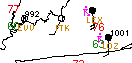
Wind Shift
In total, 37 tornadoes struck Indiana and Kentucky that day including the F-4 in Louisville and F-5 in Brandenburg. Brandenburg was hit harder than anyone as the town of 3,000 was completely leveled by an F-5. The extremely violent storm killed 31 people while sweeping much of the town into the Ohio River.

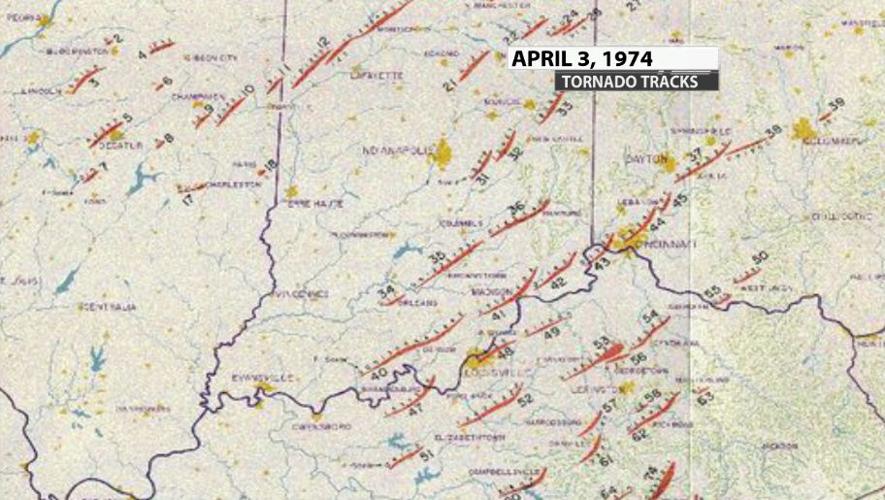
315 people lost their lives that day and another 5,000 were injured across the span of the entire outbreak which covered 13 states with a record 148 tornadoes. Interestingly, damage surveys are much better now than they were in 1974, so smaller tornadoes in 1974 could have been missed. The map below is hand-drawn by Ted Fujita, the creator of the F (and later EF-scale). He numbered each tornado from start to finish of the outbreak.

It wasn't just the shear number of tornadoes that made this outbreak stand out as one of a kind. It was the strength and longevity of these storms. In total, 64 storms reached at least F-3 in intensity with 23 F-4's and and unbelievably six achieved F-5 status! Two of those F-5's occurred in our WDRB viewing area that afternoon. To put this into perspective, the United States on average sees less than one EF-5 each year, and on this day there were SIX of them.
THEN & NOW
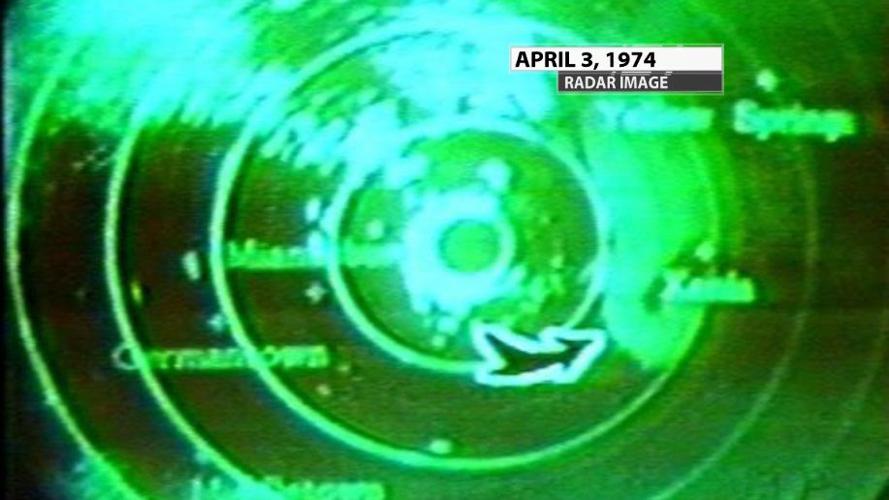


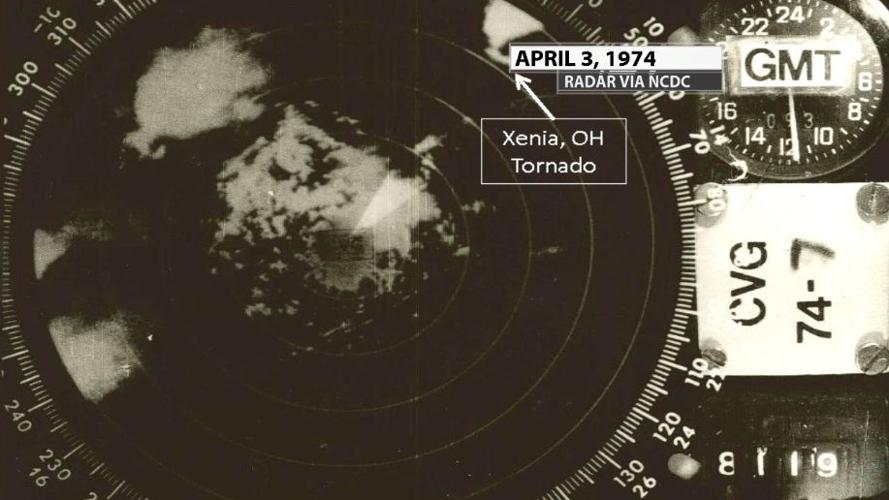
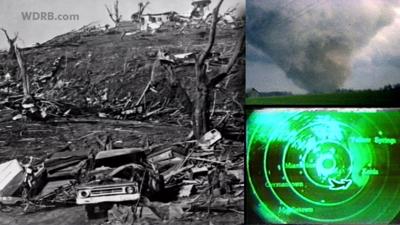
THEN & NOW | Satellite and Radar Technology
The differences between then and now come down to technology and timing. Technology has progressed so far, particularly in radar data and tools, that the images from 1974 are almost unrecognizable for what they are. Dual-pol radar now allows us to look inside of a storm, take 3-D scans, and find a tornado where no one could have detected one in 1974. Moreover communication technology has evolved as well to be able to immediately alert you if a tornado is in or near your area. Your smart phone can alert you with emergency alerts as can any weather app you have. Social media and camera phones allow people near the storm to take pictures of it (safely) and instantly share them with their community, local meteorologists, and the world. Plus you can now watch TV weather coverage on your smartphone or computer.
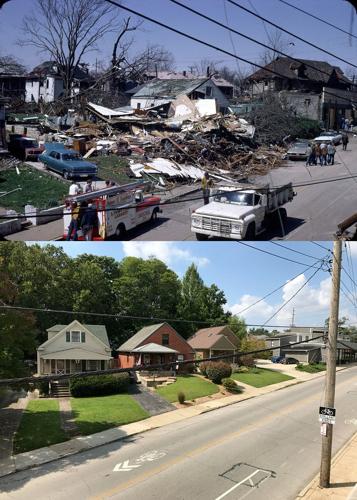

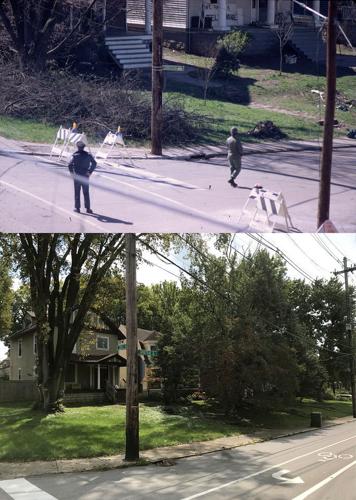


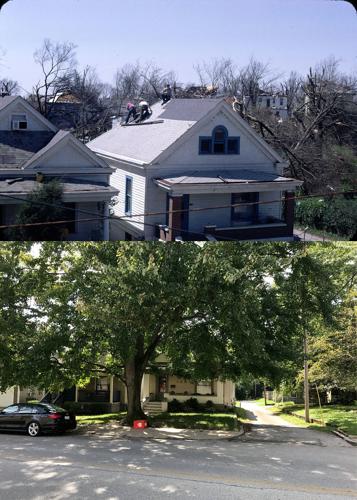
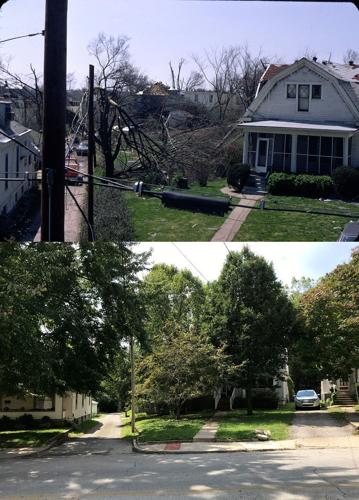


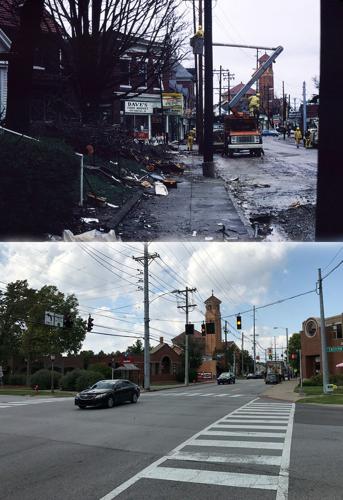

Then and Now Comparisons From Byron Graham

On the theme of comparing then to now, Byron Graham sent in this amazing collection. His father, Jesse Graham Jr (who has since passed), took all of the "before" pictures, and Byron has gone around town taking current pictures in those same locations to compare the recovery. He also has a beautiful gallery of his father's pictures of the devastation left in the wake of the April 3, 1974, tornadoes you can see here. I (Hannah) would like to extend a special "thank-you" to Byron for sharing all of that hard work with us for this piece.
COMPARED TO OTHER BIG EVENTS
As technology and the study of weather have progressed, we are able to understand more about this outbreak now than we could then. Using data collected at the time, we can compare the Significant Tornado and Supercell products between events to get a general idea of how they measure up. These images of the significant tornado parameter in the area where the outbreak took place are in order chronologically evaluating the 1974 Outbreak, the 2011 Outbreak, and the day of the Henryville tornado in 2012. Numerically these are similar, all maxing out at 6, but geographically the 1974 Outbreak is the worst by far.
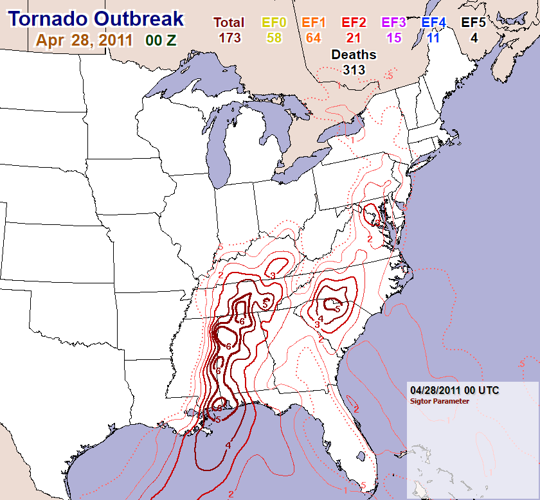

Significant Tornado Comparison
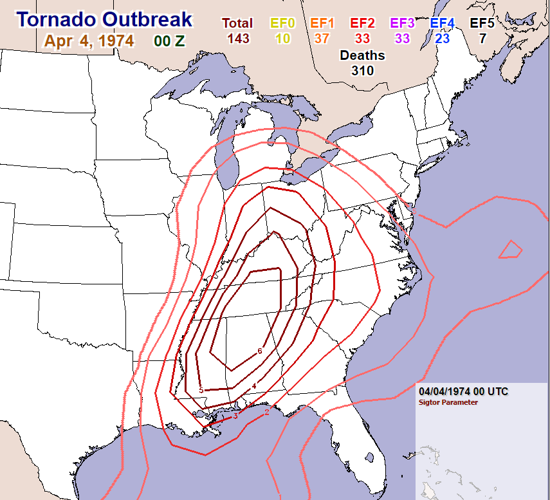
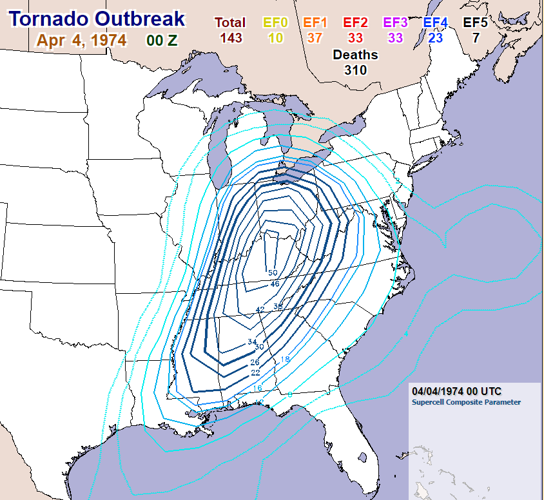
The difference becomes more striking when we look at the Supercell parameter. The ingredients that go into producing these parameters are what we look at to determine severe weather potential, so boiling it down to these two products is just a faster way to do the comparisons. Again geographically there is no comparison, but the numbers here show the stark difference between 1974 and everything else. The day of the Henryville tornado, the highest number is 18. It's around 30 for the April 2011 Outbreak, but it's 50 for April 1974.
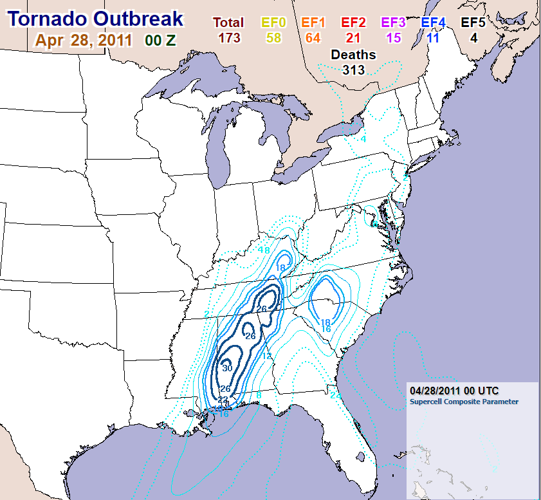
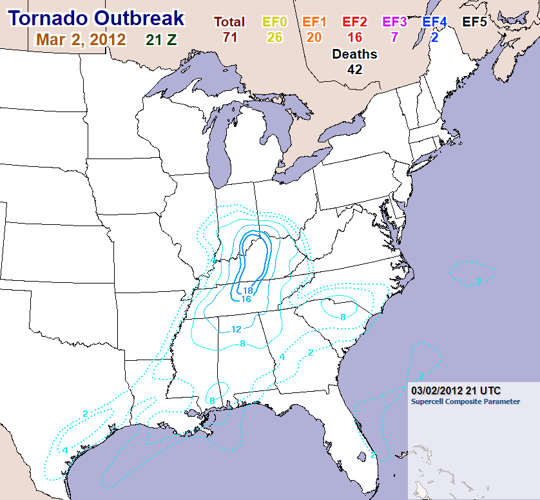
Supercell Parameter Comparison
The overall scope of the event has been recently rivaled by the Dixie Alley Outbreak of April 25-28, 2011, only in terms of shear number of tornadoes. The Super Outbreak of April 3rd, 1974, still stands alone as the most widespread and violent tornado outbreak in recorded history. In terms of total number, path length, and total damage, the massive tornado occurrence of April 3-4, 1974, was more extensive than all previously known outbreaks.


