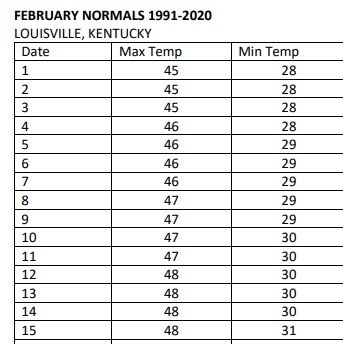
We have been experiencing unusual warmth in the last few days, but we've also seen several examples of this type of pattern this winter. So far both the high and low temperature every day in February have been above normal. You can flip back and forth between the images below to see the observed temperatures in Louisville (circled in yellow) and the normal temperatures based on climatological data. Here's a post where we discussed in depth what those "normals" mean:

We've been talking a lot lately about how our temperatures compare to "normal," so let's establish what normal is and why it provides important context.
February 2024 Observed Temps vs. Normals
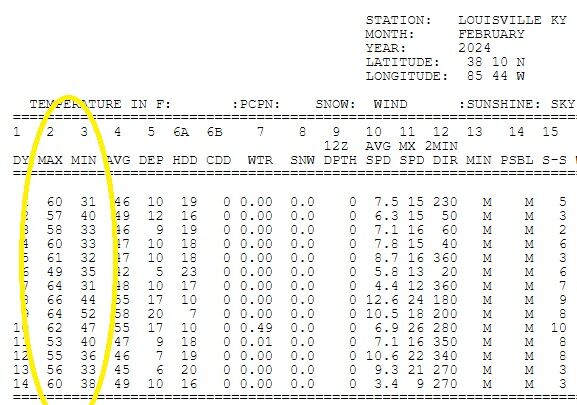
If February ended right now, it would be the third warmest on record in Louisville. With just 14 days of data, the average temperature for the month is 48.2º which is more than 10 degrees above normal. The average temperature in the warmest February was 49.0º (in 2017), and in the second warmest it was 48.4º (in 1882). Last year (2023) currently holds the third place spot with an average monthly temperature of 47.4º.

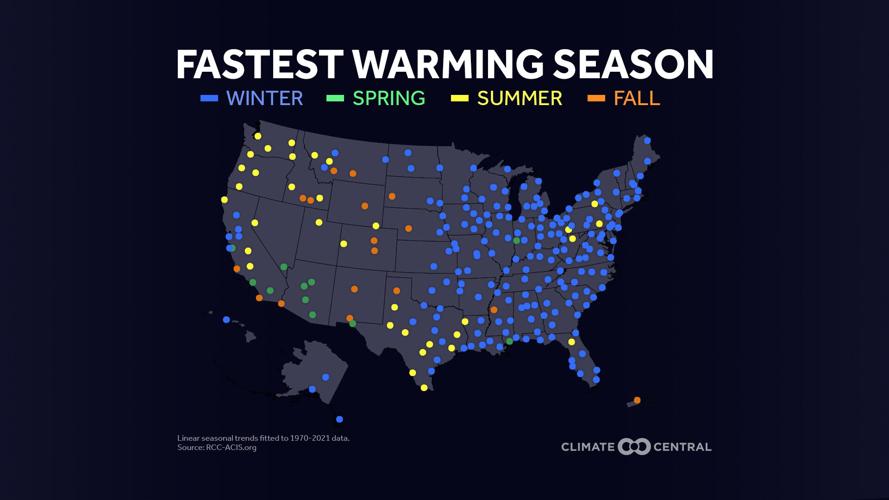
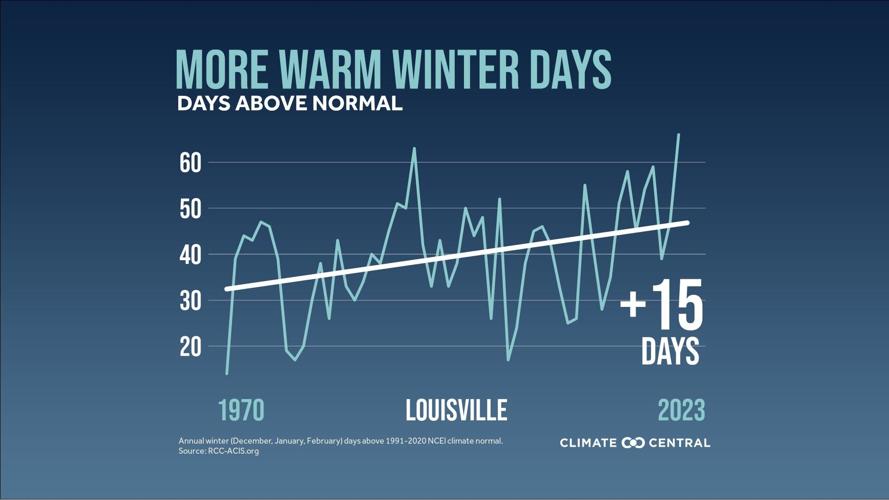
In weather record-keeping, winter is defined as the full months of December, January, and February. The warmest winter in Louisville was 1890 which had an average temperature across the season of 47.6º. Winter is also Louisville's fastest warming season, according to data collected by Climate Central. On average Louisville sees 15 more days during winter with temperatures above normal compared to 1970.

December's average temperature was 45.1º and January's was 34.7º. If you use the first half of February to calculate a seasonal average temperature is about 42.7º which would be the 9th warmest winter in Louisville. We still have two weeks to go so these February and overall seasonal numbers will change.


