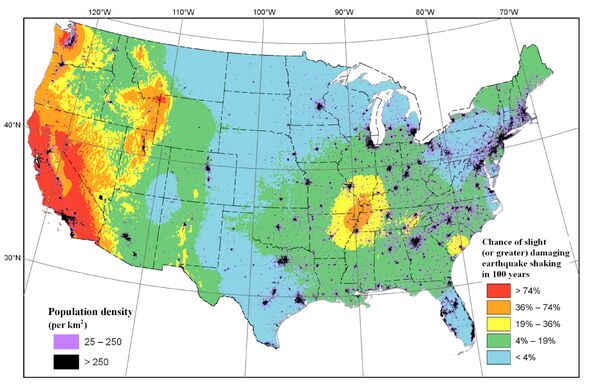

Faults, earthquakes and geology – are the ingredients that go into making a seismic hazard model. Periodically since 1976 the U.S. Geological Survey (USGS) uses the most current data and state-of-the-art forecasting methods to create an updated National Seismic Hazard Model (NSHM). Additionally, engineering analyses inform us about how built structures could react to the ground shaking forecasted by the model. The model and related maps have a surprising variety of uses, from guiding engineering design of structures to helping determine earthquake insurance rates, and informing government officials, emergency managers, and public officials about potential risks to their communities. The distinction between hazard and risk is that hazard refers to natural phenomena from earthquakes (e.g., ground shaking), whereas risk refers to consequences of the hazard (e.g., dangers the hazard poses to life and property). The USGS is currently working on the updated hazard model for the 50 states targeted for completion and release in 2023. Let’s look at what goes into the NSHM in more detail to better appreciate the improvements and progress for the 2023 model.
Faults and Earthquakes
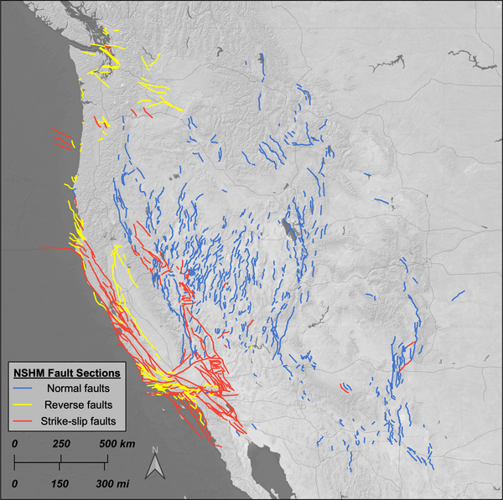
Existing faults and locations of past earthquakes are the starting point for a seismic hazard model. The location of faults is known through observations of topographic and landscape disruptions caused by movement on said faults. Earthquakes on these faults disrupt the surface features, and the date the earthquake occurred can be estimated by the age of the disrupted features. For example, if we know that a certain sediment deposit is 1,000 years old, and we see that this sediment has been cut and moved by the fault, we know that an earthquake on the fault reached the surface in the last 1,000 years. These observations can be made in the field or using remotely sensed imagery, like aerial imagery and other techniques. Unfortunately, earthquakes don’t just happen on mapped faults – they occur all the time in places where there is no fault on the map – but all those earthquakes are also taken into account in hazard models, as indicators of where and how often earthquakes could occur away from known faults.
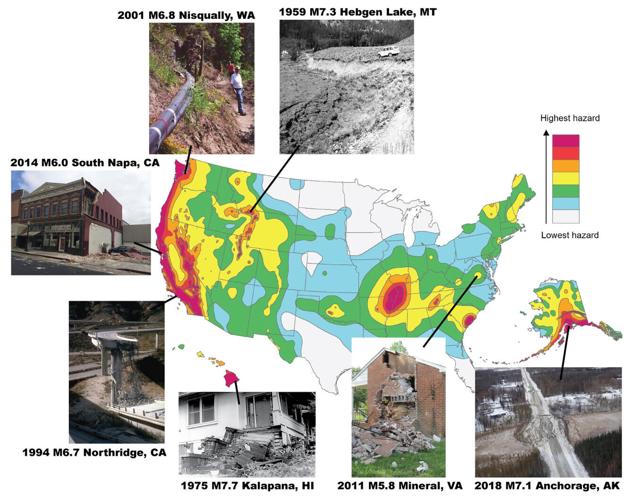
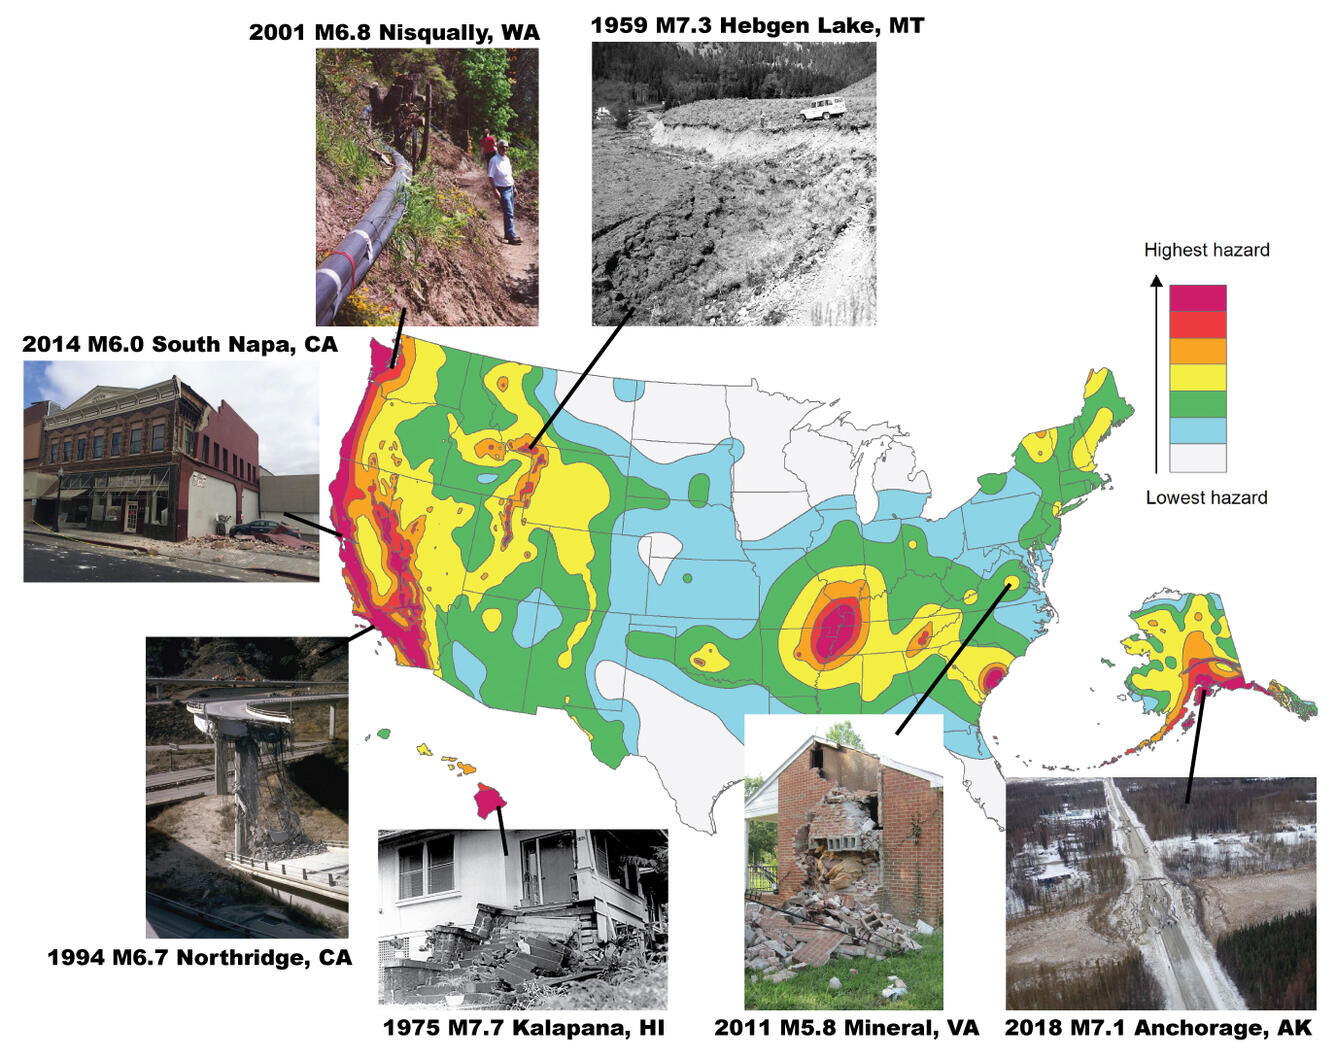
In addition to the fault locations, we need to know how active each fault is, which reflects how frequently a fault has earthquakes and how big those earthquakes may be. These activity rates can be measured both by geologists, with knowledge of how much displacement has occurred along a fault over a given length of time (like our previous example of a displaced sediment layer with a known age), and by geodesists. For example, geodesists use high-precision Global Navigation Satellite System (GNSS) instruments distributed across the western United States to determine the velocities of the Earth’s surface relative to the stable and very slowly deforming eastern United States. Although earthquakes are rare in the central and eastern United States, they do occur and can cause damage (for example, the 2011 M5.8 earthquake in Mineral, Virginia).
Combining fault locations and activity rates allows us to calculate the frequency of rupture along a given fault. The yearly frequencies of rupture are very low, so this is translated into a percent chance of a fault rupturing over a longer given time scale (for example, 10% in 50 years). This process of calculating times between earthquakes (known as recurrence) also considers the possibility of earthquakes jumping from one fault to another, as has been observed in past earthquakes such as the 1992 M7.3 Landers earthquake in the Mojave Desert of southern California. While the chances of earthquakes on a given fault are very small over short time scales like years to decades, it is important to remember that the chance of an earthquake is generally higher in California, especially near the San Andreas fault, than in areas with fewer active faults, such as Colorado.
Ground Motions
Once we’ve gathered all the best data for fault locations and how often they generate earthquakes, we want to know the level of shaking that each earthquake is likely to produce.
The ground shaking caused by fault rupture can be measured worldwide by very sensitive instruments called seismometers, but it is nearest the fault where shaking has the greatest human impact. The shaking intensity at a particular location is primarily related to: 1) the magnitude (or size) of the earthquake, 2) the distance from the fault, 3) the type of soil or rock present, and 4) the depth of bedrock. All these factors combine and trade off to generate combinations of very sudden jolts of shaking (high-frequency waves) and much slower, rocking or rolling waves (low-frequency waves). High-frequency waves can rattle short buildings (e.g., 1 to 2 stories), dams, and nuclear power plants, crack stiff walls, and topple or slide building contents that are not anchored to the structure, such as appliances or furniture. Low-frequency waves can especially affect tall buildings or long bridges, causing them to sway. Localized areas of structural damage can be caused by soft and deep soils or sudden changes in geology that amplify the shaking intensity.

Databases of past ground motions are used to make models of future potential ground shaking. When combined with fault locations and earthquake frequencies, a hazard model forecasts the chances of low- and high-frequency ground shaking intensities at any location of interest. As described below, these hazards are fed into engineering project needs and construction code applications to help improve designs of new structures or guide the retrofitting plans of old ones.
Engineering & Risk
Engineering and risk research extends the hazard model to practical civil engineering applications and provides feedback for improving the hazard model. Traditionally, the NSHM serves as a starting point for designing earthquake-resistant structures. For buildings, structural engineers need to design beams, columns, and connections of buildings to withstand shaking during an earthquake. The building codes used for these designs are based on forecasted ground motion intensities derived from the NSHM. Besides collaborating with building code partners for designing buildings, such as the Building Seismic Safety Council (BSSC), USGS engineers and scientists also collaborate on designs for other structures, such as bridges with the American Association of State Highway and Transportation Officials (AASHTO) and railways with the American Railway Engineering and Maintenance-of-Way Association (AREMA).