
The following article is courtesy of NOAA and written by Emily Becker
Well, that was quick! Just two months ago I was writing about La Niña for what seemed like the 97th month in a row, and then by March La Niña had departed. Today we’re hoisting an El Niño Watch, meaning that conditions are favorable for the development of El Niño conditions within the next 6 months. In fact, there’s a 62% chance of El Niño conditions for the May–July period. Read on for the reasoning behind the outlook, thoughts about the potential strength of El Niño, and implications for global weather and climate.
Let’s run some numbers
The March average sea surface temperature in the Niño-3.4 region, our primary monitoring region for ENSO (El Niño/Southern Oscillation, the whole El Niño-La Niña system), was 0.2° Celsius (~0.4˚Fahrenheit) below the long-term average, according to ERSSTv5. This is solidly in the ENSO-neutral range, that is, between -0.5 and 0.5 °C difference from average.
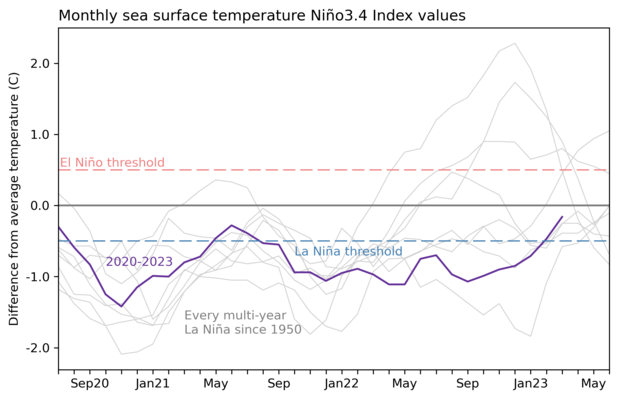
Three-year history of sea surface temperatures in the Niño-3.4 region of the tropical Pacific for the 8 existing multi-year La Niña events (gray lines) and the current event (purple line). Of all the previous 7 events, 2 went on to La Niña in their third year (below the blue dashed line), 2 went on to be at or near El Niño levels (above the red dashed line) and three were neutral. Graph by Emily Becker based on monthly Niño-3.4 index data from CPC using ERSSTv5.
The atmosphere is also looking quite neutral, overall. In March, both the Southern Oscillation Index and the Equatorial Southern Oscillation Index were close to zero. Both of these indexes measure the strength of the atmospheric component of ENSO, via the relative surface pressures in the western and central-eastern Pacific. Negative index values indicate the Walker circulation is weaker than average, an El Niño response, while positive values tells us the west-east pressure difference is greater than average, indicating a strengthened Walker circulation—a La Niña response. Near-zero, like the current values, tells us that the atmospheric patterns are near average over the tropical Pacific Ocean.
Onward!
That’s where we are… but where are we going?? There’s a 62% chance that El Niño will develop during the May–July period, and more than 80% chance of El Niño by the fall.
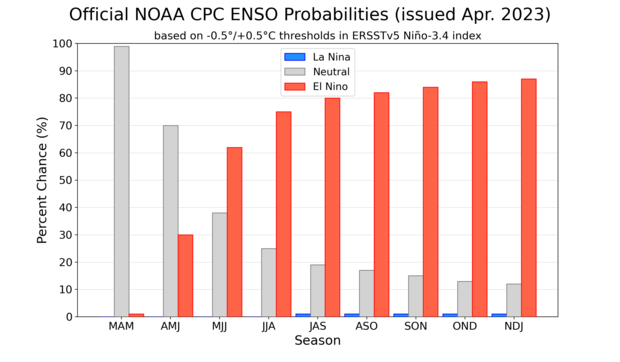
NOAA Climate Prediction Center forecast for each of the three possible ENSO categories for the next 8 overlapping 3-month seasons. Blue bars show the chances of La Niña, gray bars the chances for neutral, and red bars the chances for El Niño. Graph by Michelle L'Heureux.
We spend a lot of time and effort monitoring and predicting ENSO because it can give us an idea about upcoming potential weather and climate conditions (and because it is a fascinating natural system!). When El Niño or La Niña are holding court in the tropical Pacific, they can affect global temperature and rain/snow patterns in specific ways, with the strongest impacts during the winter. Since ENSO can be predicted months in advance, we can start playing the odds on what sort of climate patterns can be expected. There is a lot of variety, and no prediction is ever perfect! But it’s currently the best tool we have to anticipate upcoming seasonal conditions.
I’ll get back to the potential impacts of El Niño in a minute—first, let’s discuss this confident forecast. Forecasts made during the spring are often less accurate than those made other times of the year. ENSO tends to change phase during the spring, and the tropical Pacific ocean-atmosphere system can be more susceptible to smaller pushes like short-term weather variations, contributing to the “spring predictability barrier.” So it seems the forecasters are really feeling their oats this month, to be giving El Niño such relatively high odds. What’s behind this?
First, the latest runs from our computer climate models are providing very high probabilities that El Niño will develop this year. When there is a lot of agreement among the models, we tend to give more credence to their predictions. For some examples, here’re Niño-3.4 forecasts from the European multi-model ensemble, Australia’s ACCESS-S2, and the North American Multi-Model Ensemble.
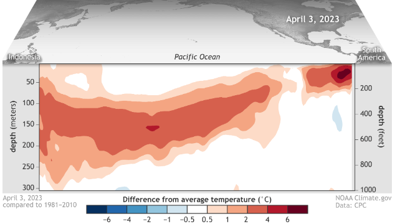
But it’s not just model advice supporting the forecast. We always keep an eye on the temperature of the water under the surface of the tropical Pacific. After many months cooler than average, the amount of warmer subsurface water has increased over the past month as a downwelling Kelvin wave—an area of warmer water that sloshes from the west to the east beneath the surface—traverses the tropical Pacific.
Water temperatures in the top 300 meters (1,000 feet) of the tropical Pacific Ocean compared to the 1991–2020 average in February–April 2023. NOAA Climate.gov animation, based on data from NOAA's Climate Prediction Center.
This warm subsurface will provide a source of warmer water to the surface over the next couple of months and helps provide confidence in the forecast.
Further bolstering the chance for El Niño is a short-term forecast for the Madden-Julian Oscillation (MJO). The MJO is an area of storminess that travels west-to-east along the equator. It’s flanked by wind anomalies, as surface level winds rush toward the area of storminess. The MJO is predicted to be in a phase that will weaken the trade winds (the consistent east-to-west winds near the equator) over the next couple of weeks. Weaker trade winds allow the surface to warm and can contribute to the growth or propagation of downwelling Kelvin waves.
One more observation supporting the potential development of El Niño is the currently very warm far-eastern Pacific. The Niño-1+2 index, which measures the sea surface temperature off the coast of Peru, was near-record warm in March. A coastal El Niño like this can precede a larger El Niño event, although not always.
To summarize, there are several signs pointing to the development of El Niño, including model predictions and the current state of the ocean and atmosphere. It’s still possible that a developing El Niño will sputter out, and the forecast includes around a 1-in-8 chance of neutral conditions in the late fall. However, from our current vantage point, there is enough evidence to support a confident forecast for El Niño.
How strong of an El Niño are we talking?
That’s a lot of support for El Niño developing, but how strong it will get if it forms is a different question. Some of the models are predicting pretty extraordinary Niño-3.4 values, but we put a lot less trust in those predictions—models tend to overestimate, especially in the spring. The ENSO team has a method of predicting the strength of an El Niño or La Niña event that combines human forecasts and model predictions. This method has shown promise so far, although we’ve only been using it for a couple of years. (Lots more detail in Tom’s post on the topic.) By that method, the current chance for a strong El Niño (Niño-3.4 greater than 1.5 °C) is about 4 in 10; a clearer picture of the potential strength of El Niño will develop as we emerge from the spring barrier.
What would an El Niño mean for global climate?
Right, I promised to get back to impacts! El Niño influences the Atlantic and Pacific hurricane seasons, usually leading to fewer tropical storms and hurricanes in the Atlantic and more than average in the Pacific. In the case of the Atlantic, El Niño increases vertical wind shear—the change in wind direction and strength from the surface to higher in the atmosphere—which can impede a hurricane’s growth. NOAA’s hurricane outlook comes out next month, so keep your eyes peeled for that.
You can check out some of the El Niño-related expected temperature and precipitation patterns during June–August and December–February here. We’ll get into more detail about these potential patterns in coming months.
One last comment! ENSO has a strong relationship with the global average temperature: in general, the warmest year of any decade will be an El Niño year, and the coolest a La Niña one. Global warming means that we can’t just say “El Niño years are warmer than La Niña,” since recent La Niña years (we’re looking at you, past 3 years!) have featured much higher global averages than El Niño years from the 1990s and earlier. 2022 was the 6th warmest year since records began in 1880, and that was with a non-stop La Niña. If El Niño develops this year, it increases the odds of record-warm global temperature.
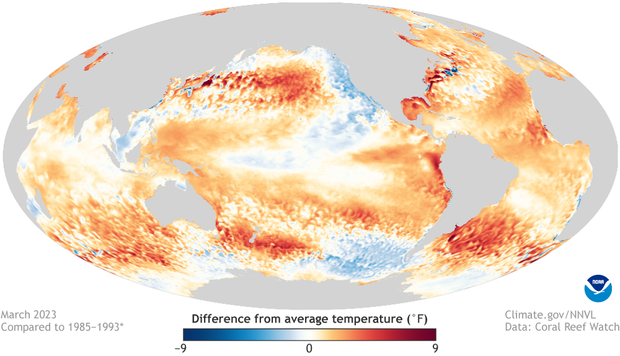
Map showing the March 2023 sea surface temperature difference from the long-term average. Figure by climate.gov from NOAA Coral Reef Watch data.


