


More accurate maps based on data from the SWOT mission can improve underwater navigation and result in greater knowledge of how heat and life move around the world’s ocean.
There are better maps of the Moon’s surface than of the bottom of Earth’s ocean. Researchers have been working for decades to change that. As part of the ongoing effort, a NASA-supported team recently published one of the most detailed maps yet of the ocean floor, using data from the SWOT (Surface Water and Ocean Topography) satellite, a collaboration between NASA and the French space agency CNES (Centre National d’Études Spatiales).
Ships outfitted with sonar instruments can make direct, incredibly detailed measurements of the ocean floor. But to date, only about 25% of it has been surveyed in this way. To produce a global picture of the seafloor, researchers have relied on satellite data.
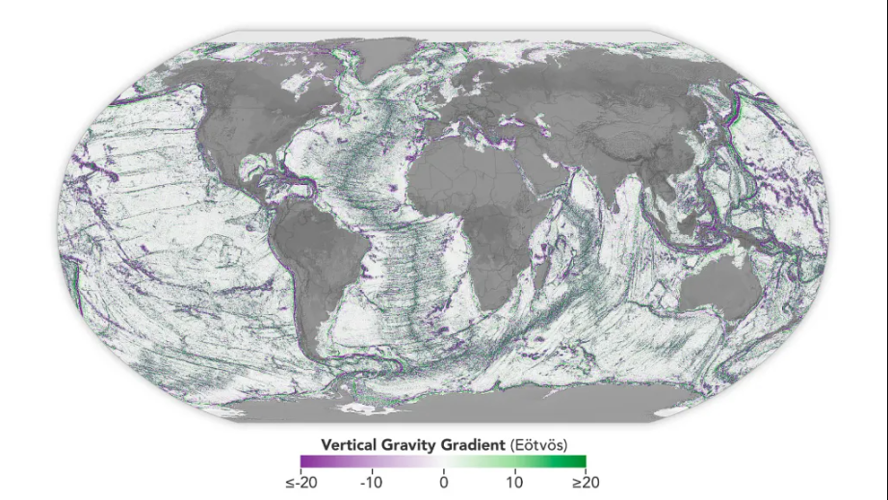
Launched in December 2022, SWOT uses state-of-the-art phase-coherent interferometry to measure two-dimensional sea surface heights with high precision. Using 1 year of SWOT ocean data, we derive a global gravity field approaching a spatial resolution of 8 km, revealing more details than 30 years of satellite nadir altimetry. In this vertical gravity gradient map, individual abyssal hills, some spanning 200 to 300 kilometers, are now visible across ocean basins, along with thousands of small seamounts and previously hidden tectonic structures buried underneath sediments and ice. With the mission still ongoing, SWOT promises critical insights for bathymetric charting, tectonic plate reconstruction, underwater navigation, and deep ocean mixing.
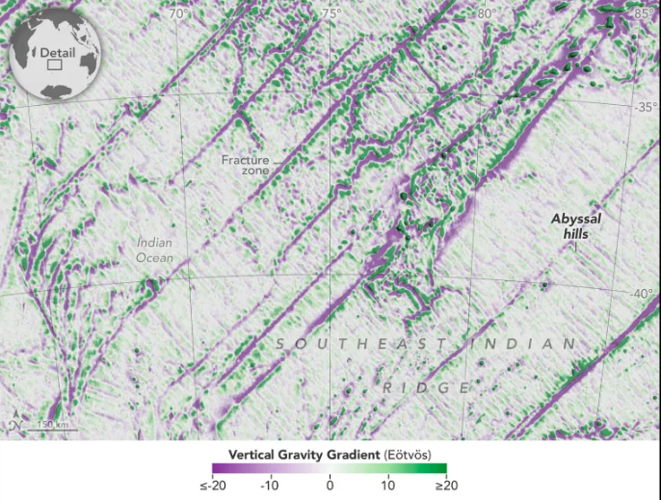
Abyssal hills (in the Southern Indian Ocean of this visualization) are the most common landform on the ocean floor, rising a few hundred meters above the abyssal plain. Formed by normal faulting along mid-ocean ridge axes, these gently undulating hills were previously difficult to resolve at a global scale. The SWOT gravity map now reveals individual abyssal hills, enabling studies of plate reconstructions and the impact of rough topography on ocean mixing.
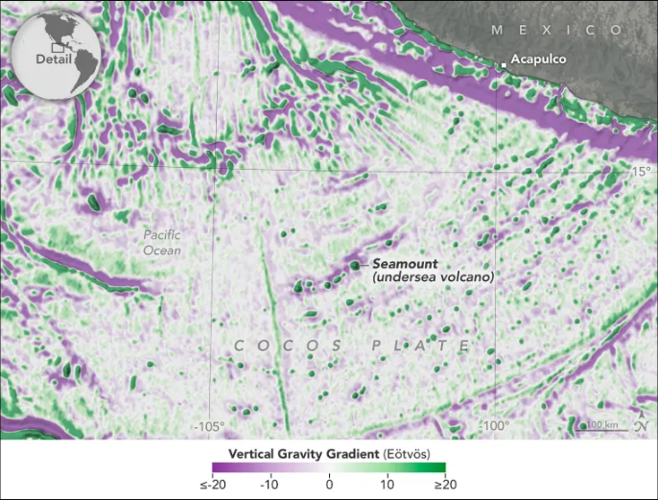
Seamounts (west of Central America in this visualization) are undersea volcanoes formed by magmatic intrusions through the oceanic crust. They shape ocean circulation, influence nutrient distribution, and serve as biodiversity hotspots. SWOT’s high-resolution mapping is expected to uncover approximately 50,000 previously unknown seamounts around 1 km in height, significantly enhancing our understanding of seafloor geomorphology.
SWOT offers unprecedented clarity at continental margins, particularly in high-latitude regions, revealing tectonic features buried beneath sediments and ice. For instance, it captures submarine canyons transporting sediments from land to the deep sea along the South American continental shelf, as well as ancient spreading ridges concealed beneath ice in the Weddell Sea.
Visualizations by: Greg Shirah
Scientific consulting by: David Sandwell, Yao Yu,
Communications support: Jane Lee
Technical support: Ella Kaplan, Laurence Schuler, and Ian Jones
This animation shows seafloor features derived from SWOT data on regions off Mexico, South America, and the Antarctic Peninsula. Purple denotes regions that are lower relative to higher areas like seamounts, depicted in green. Eötvös is the unit of measure for the gravity-based data used to create these maps.
NASA’s Scientific Visualization Studio
Why Seafloor Maps Matter
More accurate maps of the ocean floor are crucial for a range of seafaring activities, including navigation and laying underwater communications cables. “Seafloor mapping is key in both established and emerging economic opportunities, including rare-mineral seabed mining, optimizing shipping routes, hazard detection, and seabed warfare operations,” said Nadya Vinogradova Shiffer, head of physical oceanography programs at NASA Headquarters in Washington.
Accurate seafloor maps are also important for an improved understanding of deep-sea currents and tides, which affect life in the abyss, as well as geologic processes like plate tectonics. Underwater mountains called seamounts and other ocean floor features like their smaller cousins, abyssal hills, influence the movement of heat and nutrients in the deep sea and can attract life. The effects of these physical features can even be felt at the surface by the influence they exert on ecosystems that human communities depend on.

The map of seafloor features like abyssal hills in the Indian Ocean is based on sea surface height data from the SWOT satellite. Purple denotes regions that are lower relative to higher regions like abyssal hills, depicted in green. Eotvos is the unit of measure for the gravity-based data used to create these maps. - Nasa Earth Observatory

The global map of seafloor features is based on ocean height data from the SWOT satellite. Purple denotes regions that are lower compared to higher features such as seamounts and abyssal hills, depicted in green. Eotvos is the unit measure of gravity-based data used to create these maps. - Nasa Earth Observatory

The map of ocean floor features like seamounts Southwest of Acapulco, Mexico, is based on sea surface height data from SWOT. Purple denotes regions that are lower relative to higher regions like seamounts, indicated with green. Eotvos is the unit measure of gravity-based data used to create these maps. - Nasa Earth Observatory


