
Last month Antarctica recorded it's highest temperature ever, and you can see the effects from space!
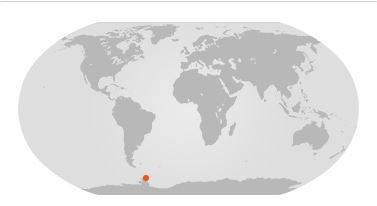
Map from NASA
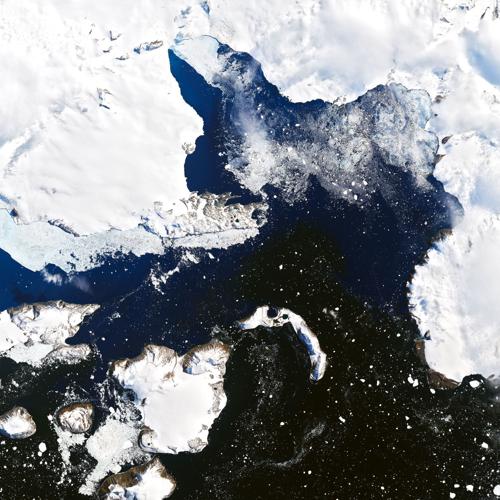
On February 6 the temperature at the Esperanza Base (on the northern tip of the Antarctic peninsula) climbed to 64.9ºF (18.3ºC). Coincidentally, that was nearly the same as the temperature in Los Angeles that day, according to a post by NASA Earth Observatory. This was actually part of a whole week of warmth for the area. The image below from Landsat8 shows Antarctica on February 4, before this warm-up started.

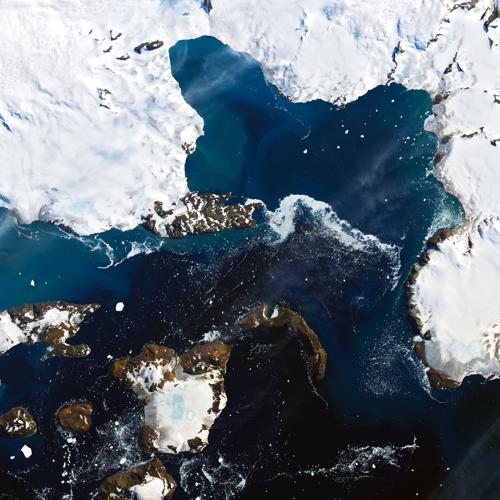
Mauri Pelto is a glaciologist at Nichols College who spoke with NASA about this event. He observed roughly 1.5 square kilometeres (0.9 square miles) of snowpack "became saturated with meltwater" through this period. The image below is from February 13th and shows that melting in blue.

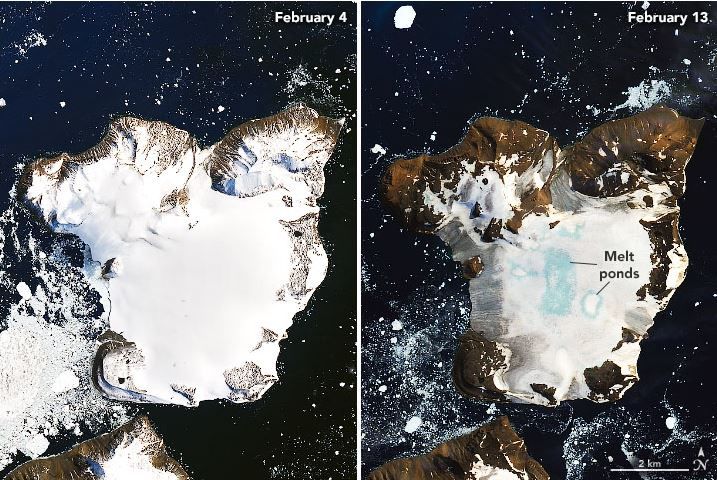
Pelto went on to share that according to climate models, peak melting on Eagle Island (see below) occurred on February 6. That peak was about one inch, but the snowpack on Eagle Island melted about 4 inches from February 6 - February 11. That level of melting accounts for roughly 20% of melting that occurs in the entire season, but it happened in just about a week during this event. Pelto added, "I haven’t seen melt ponds develop this quickly in Antarctica...you see these kinds of melt events in Alaska and Greenland, but not usually in Antarctica." You can very clearly see melting on Eagle Island. Below is a zoomed in comparison from February 4th (before the warm-up) and February 13th (after the warm-up ended) side by side. Notice the melt water pointed out in the comparison. These images were taken by Landsat8, a satellite orbiting the Earth 705 km (438 mi) away.
There were also two large melting events earlier this season in November and in January, showing this melting is largely a result of a changing climate. Weather during this week also played a significant role in the rapid melting. There was a ridge of high pressure centered over Cape Horn which allowed warm air to build. That same process happens here under a ridge of high pressure.
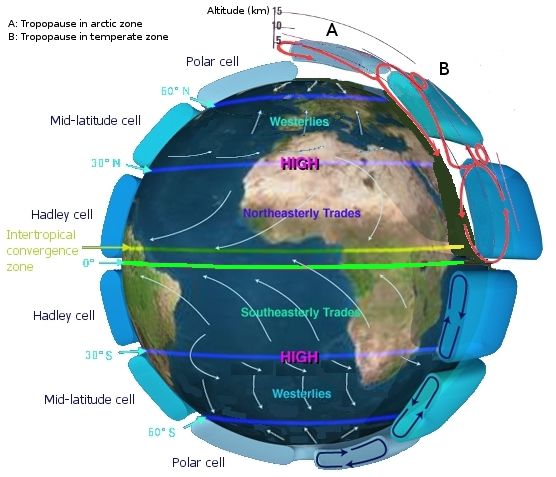
This part of the world is usually blocked from that warm air by the Southern Hemisphere westerlies, a belt a wind that circles the globe. See the image above from NASA for a map of these global-scale wind patterns. The problem for Antarctica arose when the westerlies weakened. That allowed warmer air to move farther across the Southern Ocean and get to this ice sheet. Sea surface temperatures were also 2-3ºC higher than normal, which added to the heat in the region.


