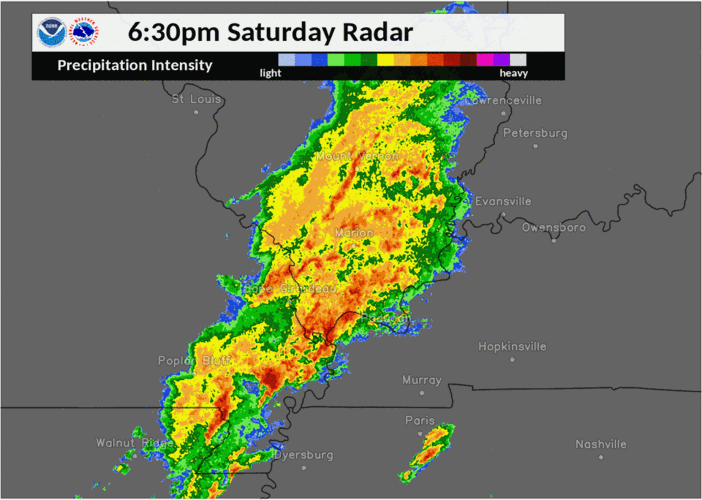

Saturday night, March 28th, we increased our staffing for the possibility of multiple tornadoes touching down in our region. As the strongest storms drew nearer to us, Chief Meteorologist Marc Weinberg and I were closely watching a tornado warned storm approaching the greater Evansville area.

The National Weather Service office in Paducah has since confirmed two tornadoes touched down in that area Saturday, and we got an incredibly rare look at one of those.
90 mph wind measured on the KY mesonet as storm went through Henderson, KY.
— Marc Weinberg (@MarcWeinbergWX) March 29, 2020
One of the wind sensors on the Kentucky Mesonet reported at 90 mph wind gust as the storms moved through! We knew instantly that needed a closer inspection. A wind gust 50-70 mph would have made sense in that storm, but not 90 mph. There was a possibility that Mesonet site had sampled a tornado, which is incredibly rare. It's virtually impossible to predict the exact coordinates where a tornado will touch down so getting real measurements of a tornado (not modeled data or theories) is very rare.
The Kentucky Mesonet has never had a direct hit by a tornado at one of their sites. There was another close call in 2008 in Barren county, but the wind recorded then wasn't as strong as this time. This is the third highest wind gust ever recorded by a Kentucky Mesonet site, and it is the highest ever from a tornado on the Mesonet. The two strongest wind gusts were from straight-line wind:
- 100.8 mph on April 25, 2011 in Calloway County
- 92.1 mph on June 26, 2015 in Warren County
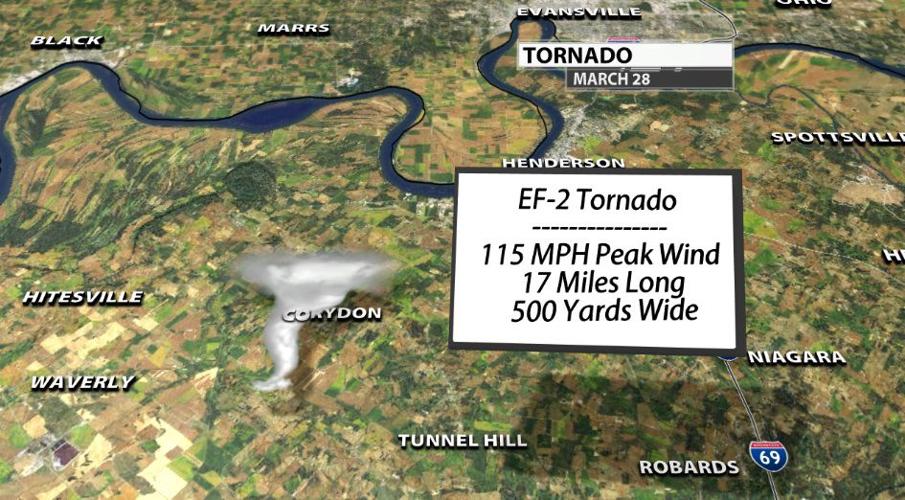
We want to thank the Kentucky Mesonet for this incredible data and for being such a fantastic partner to work with. They provided us the minute-by-minute data, so we could determine if a tornado actually struck that observing site. This tornado in Henderson county was rated as an EF-2 with peak wind speeds estimated to be 115 mph. It was on the ground for 17 miles and was 500 yards wide at it's maximum. That's as wide as five football fields!
ANALYSIS
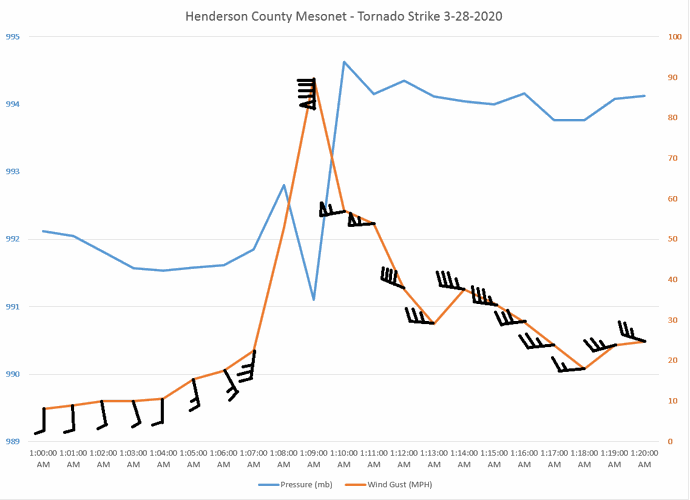
The blue line in the graph below is pressure in millibars and the orange line is wind gust in mph with the direction superimposed using wind barbs. The time at the bottom is noted in UTC and moves in one minute steps.

Everything looks pretty much like you would expect as a thunderstorm approaches, except what happens in the middle. Notice the rapid pressure drop and the increase in wind gust speed. That one minute flip is what we're going to focus on, so let's separate this out by variables.
PRESSURE
We know the pressure drops inside a tornado because of a principle called cyclostrophic wind balance, so that's what first grabbed our attention. However, we would expect a drop closer to 50 mb for what turned out to be an EF-2 tornado. This dropped less than 2 mb then rose about 3 mb.
Cyclostrophic wind balance describes the relationship between pressure and wind that makes the wind rotate in a tornado. To allow wind that strong (115 mph in this case) to keep rotating, the pressure has to drop very far very fast to keep the wind spiraling around the center of rotation. The Pressure Gradience Force (PGF) has to be strong enough to balance the centripetal force in the tornado.
Centripetal force is something you're already familiar with - it's the force that makes you feel like you're going to fly off the merry-go-round when it starts spinning too fast on the playground. When an object is spinning, centripetal force pushes out from the center of rotation. The PGF (pressure gradient force) has to balance that to keep the tornado spinning. Wind flows from high to low pressure, just like a ball rolling down a hill (from high to low). Outside the tornado is higher pressure, inside is lower pressure; PG force is pulling back in toward the center of rotation and balances the centripetal force.
Notice also that the pressure rises a bit right before and right after that significant drop. Again, we again look to the cyclostrophic profile for why this happens. The pressure is lower inside a tornado than it is outside, but on the edges of the wind profile the pressure will be slightly higher. Think about this logically - the tornado extends down from the storm cloud, so somewhere there has to be air moving down. Air moving down applies a higher amount of pressure to the ground, just like when you place your hand on a table and press down. You are applying higher pressure to the table just like the wind is to the ground. That's why we see that very slight pressure rise right before and right after the big drop.
WIND
Now as we consider the wind, the large jump in speed is what first caught our attention. A wind gust just over 20 mph was recorded right before the big 90 mph gust, so obviously something changed there. The change in wind direction can help us figure out what happened. Since we will be referring to it again, this the same graph from above so it's easier to see while we discuss here.
Notice how the wind veers as the storm approaches the observing site then backs hard to the south as the storm is passing. Translation: at 1:04 the wind was coming from due south, at 1:05 and 1:06 is progressively turns more to the southeast, then at 1:07 and 1:08 it turns back to the south. It may not look like a huge change, but this is a key signature we look for when detecting tornadoes. That change to the south is critical to ruling out another very windy part of a severe thunderstorm, the RFD (rear flank downdraft). An RFD brings air down from the thunderstorm on the back edge and can bring very strong wind gusts. Based on the position of the storm at this point, the wind coming out of the RFD would be westerly, so this is not that. At the peak wind strength, the wind direction is coming out of the south.

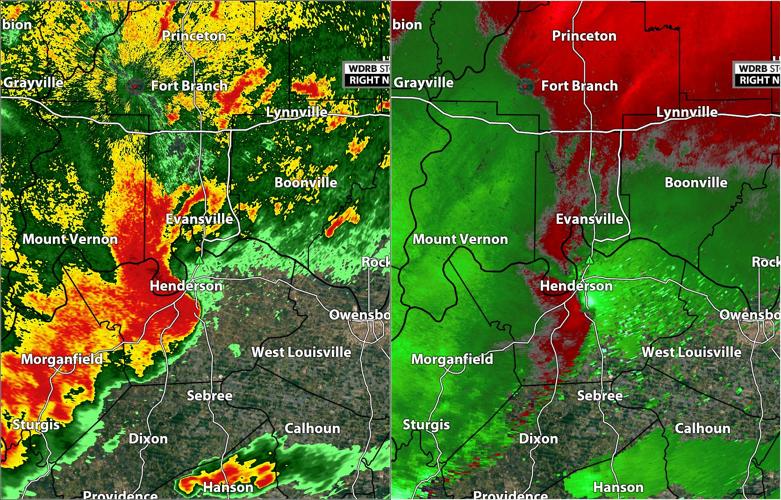
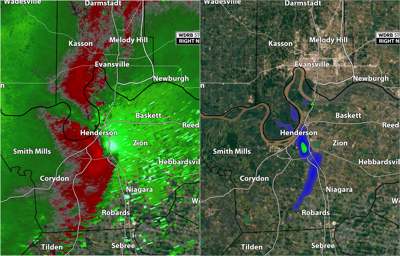
We can take those data and observations and compare it to what we saw on radar Saturday night. In the image above, you're seeing Reflectivity on the left and Storm Relative Velocity on the right. When you look at those two products together, you can see how the wind is moving inside the storm and what features might be present. For example, in the image on the right there's a ball of bright green color with some red wrapped around. That tells us there's likely rotation happening inside the storm. When you look at that same location on the left side, you see the bright red color surging out ahead of the rest of the rain.
Next look in the right image at the line of green that extends northwest out of the "d" in Henderson. When you compare that same location to what is happening in the image on the left, there are some brighter reds and almost a purple color in that same line area. The image on the right shows the direction the wind is moving: red is away from the radar and green is toward. That strip of green could be showing us the inflow jet bringing strong wind into the thunderstorm to keep feeding it. The higher reflectivity in those same areas on the left side could support that, too.
CONCLUSION
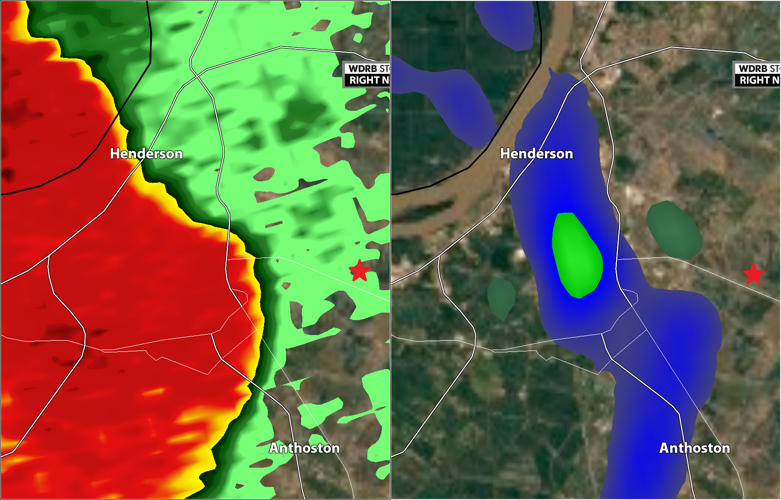
This data suggests the tornado may have brushed the observing site, but did not hit it directly. The pressure drop doesn't seem to be significant enough for this site to have taken a direct hit from the center of the tornado. The wind changing direction so fast (nearly 70 mph in 60 seconds) and the pressure change during that wind shift tell us it was sampling a tornado environment, but not taking a direct hit from the tornado. To be more specific, this site likely sampled the east edge of the tornado in Henderson county. We know that because as it passes the site, the wind shifts to the WNW which is appropriate for the southern edge. The image below shows the area of strongest rotation on the right side, the "normal" radar view (reflectivity) on the right, and the Mesonet site that measured all of this is marked with a star in both panels to get an idea of where it's positioned relative to the storm.

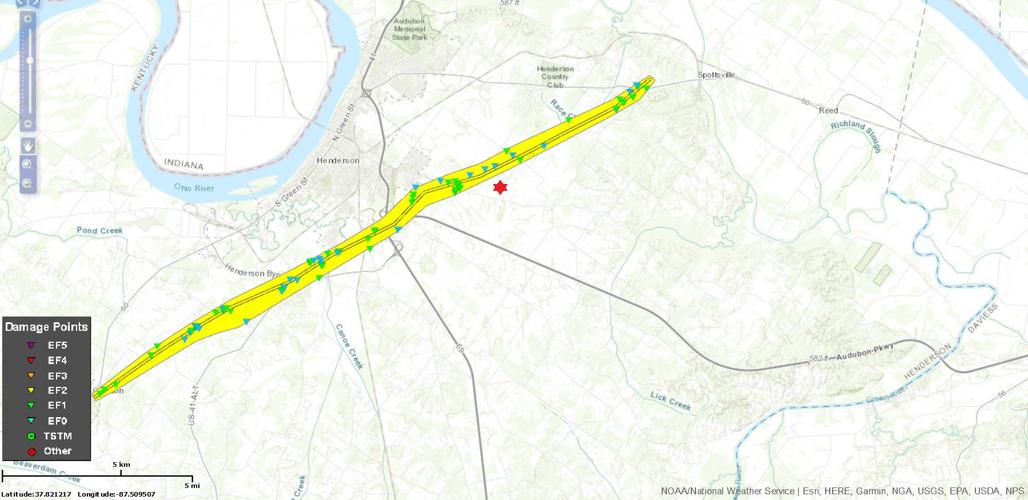
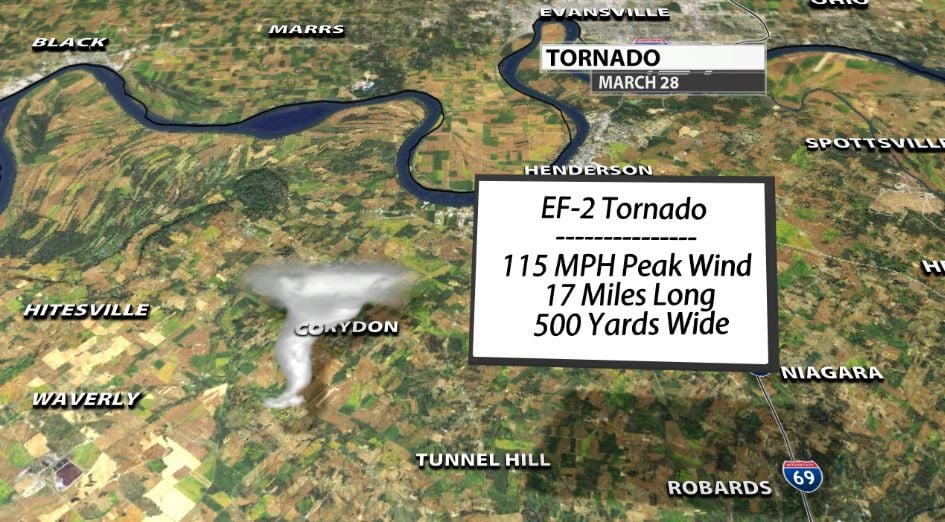
The other possibility is that the Mesonet site is sampling the inflow jet in this storm. The inflow jet is basically a funnel of incredibly strong wind flowing into the storm, feeding the tornado. As we discussed above, the wind and pressure change at the same time suggests a nearby tornado. Holding all of the things we've already discussed and looking at the storm positioning and structure, the massive wind gust could have been the inflow jet flowing into the tornado. The red star in the image below is the Kentucky Mesonet site that recorded the 90 mph wind gust in relation to the path of this tornado (shown in yellow).

We again want to thank Kentucky Mesonet for the service they provide to the weather community, so we can pass real-time data along to you. We are grateful to them for sharing this data.


