

Now that winter is over and we are done with the weak La Nina we saw over the last season, all eyes are now on ENSO.
ENSO is one of the most important climate phenomena on Earth due to its ability to change the global atmospheric circulation, which in turn, influences temperature and precipitation across the globe.
Even though ENSO is a single climate phenomenon, it has three states, or phases, it can be in. The two opposite phases, “El Niño” and “La Niña,” refer to the warming and cooling of sea surface temperatures (SST), in the central and eastern tropical Pacific Ocean.
We just got through a weak La Nina, but now things are about to change in a big way!
La Niña Current
Right now, a La Niña Advisory remains in effect which means current conditions are observed and expected to continue. Based on the latest forecast, a transition from La Niña to ENSO-neutral is expected in the next month, with ENSO-neutral favored through May-July 2026 (55% chance). In June-August 2026, El Niño is likely to emerge (62% chance) and persist through at least the end of 2026.
El Nino Watch
With El Nino likely to emerge and persist through at least the end of the year, we are currently under an El Nino Watch. You can see that many of the best models in the world are picking up on El Nino appearing.

Image: NOAA
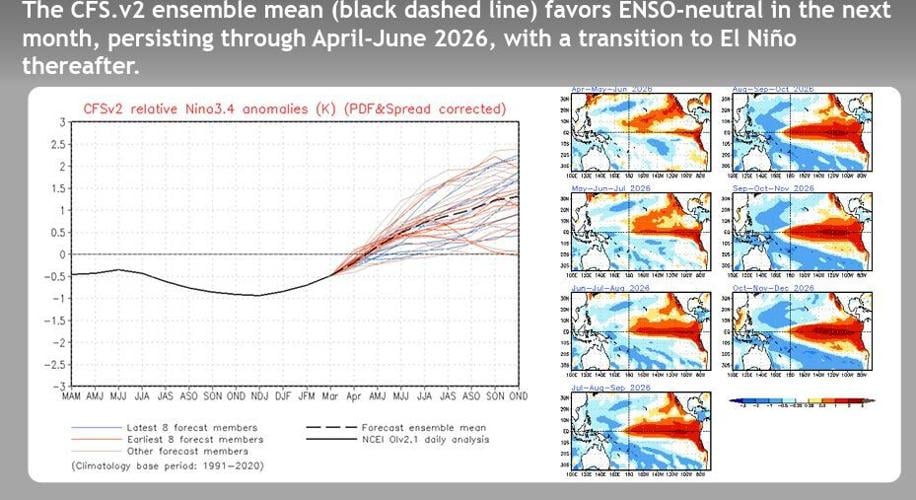
Not only is El Nino emerging, but there are signs for a strong El Nino and even a few cases where some models take it to very strong El Nino, sometimes referred to as a "super El Nino". "Strong" El Nino's are typically defined with a 1.5 to 1.9 SST anomaly, while "very strong" El Nino's are typically defined with 2.0 or great SST anomalies. You can see in the graph above where the models take the El Nino strength by late summer and into the middle of fall/beginning of winter.
While there are some outliers, the overall model mean (average) takes the El Nino strength to around 1.5 SST anomaly. That would classify this as a "strong" El Nino, not "very strong" just based on the model averages. Could a "very strong" or "super El Nino" still take place? It's possible, as some models still show that.
What does a "Strong" El Nino for our area look like?
If we're going just based off the model averages and this turning into a "strong" El Nino during the Fall, what does that typically mean for our area in terms of temperature and precipitation heading into the end of the year? Let's look at August through October when El Nino really starts to ramp up...
Temperature
We've had 6 recorded years on record with a "strong" El Nino, most recently in 2023-24. Based on those years, temperatures on average end up below normal August - October.
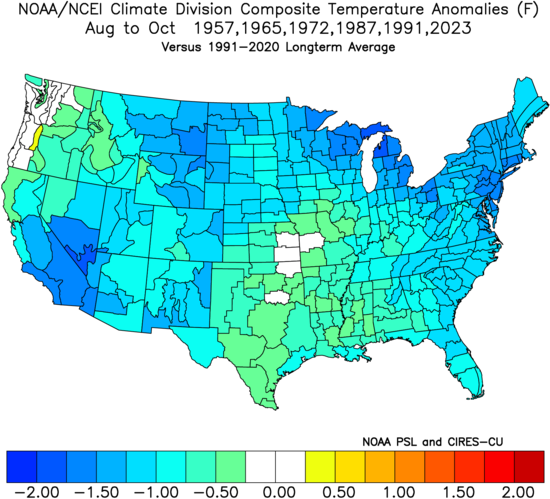
Interesting right? Other than a few locations across the US, the general consensus is below-average temperatures, including Kentuckiana.
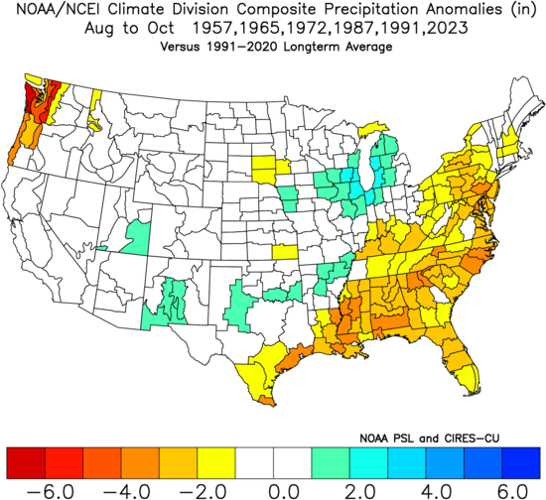
Precipitation
We know that "strong" El Nino's typically provide somewhat below normal temperatures in our area, so does precipitation line up with above or below. Well, based on the data from the previous "strong" El Nino's, we typically lean a little bit toward drier than normal! This is especially true for much of the southern US, but it still does include us, just not as dramatically as a location like Mississippi or Alabama.

So, if we end up seeing a "strong" El Nino toward the end of the year, Fall typically ends up being cooler and drier than normal!
What does a "super" El Nino look like for our area?
We've gone through "strong" El Ninos for our area, but what about "very strong", or "super" El Nino's? After all, there is some model data as we talked about earlier that do show that being a potential.
Well, we're pretty limited on data for "very strong" El Nino's because of how rare they are. In fact, we only have the data for just 3 that have occurred. Those being in 1982-83, 1997-98, and 2015-16. So with that being said, we have to take these analogs with a grain of salt, because any "extremes" can cause a drastic change in data.
Temperature
With the limited data that we have for "super" El Nino's, the August - October timeframe leans heavily toward below normal temperatures as well. Even though we only have 3 years when this occurred, the data obviously shows that being the better potential for our area.
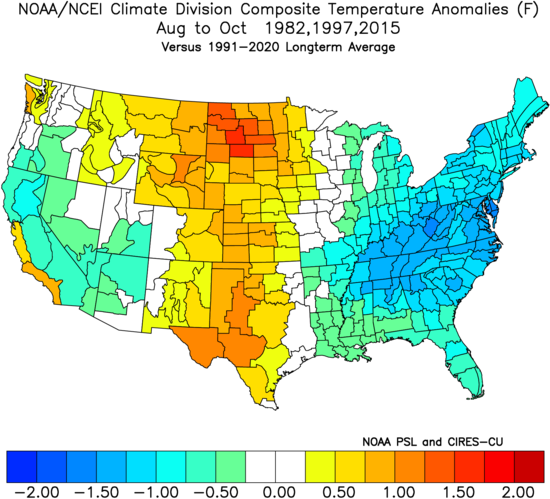
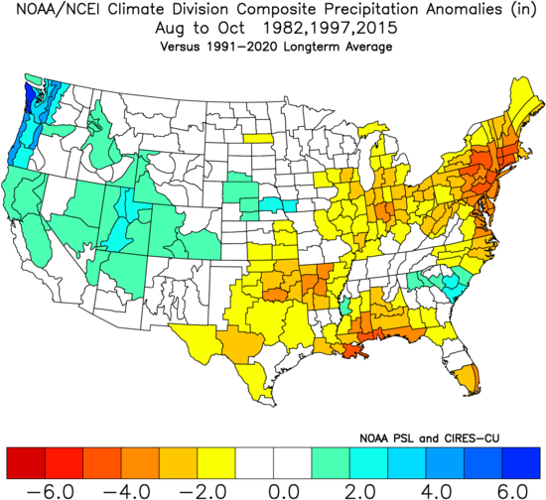
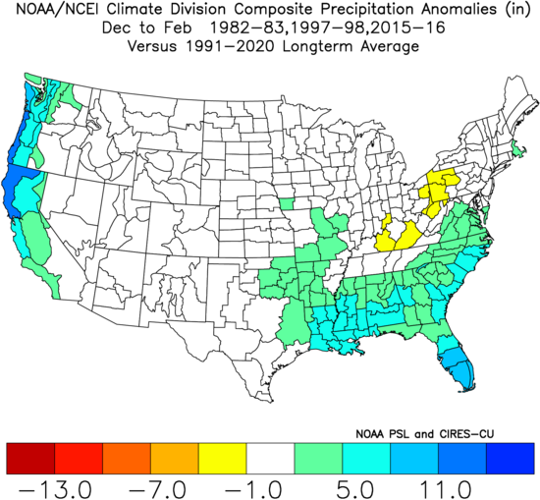
Precipitation
Could a stronger signal for below normal temperatures if we have a "very strong" El Nino mean a better chance for an early snow? Well...maybe not. When we look at precipitation averages for those 3 instances we had a very strong El Nino, we end up near average for precipitation. I say "near" average because there is some hints of below average as well in there, but it is not definitive across our area.

Strong/Very Strong El Nino & Hurricanes
While those analogs can give us a little bit of an idea on what could happen if a strong or very strong El Nino did occur, they're not gospel. What is much higher in confidence is that strong and very strong El Nino's historically reduce hurricane activity in the Atlantic!
This makes sense because when we have El Nino's, that increases the wind shear in the Atlantic Basin. That is what hurricanes hate because more vertical wind shear tears tropical systems apart!
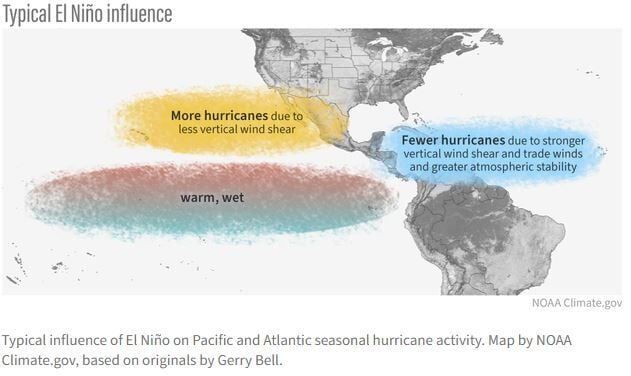
Image: NOAA
Winter "Strong" El Nino For Our Area
IF a strong El Nino held into winter (Dec-Feb), what would that do for our area? Again, we're pretty limited on sample size here with only 6 strong El Nino's recorded, but here's what it shows...
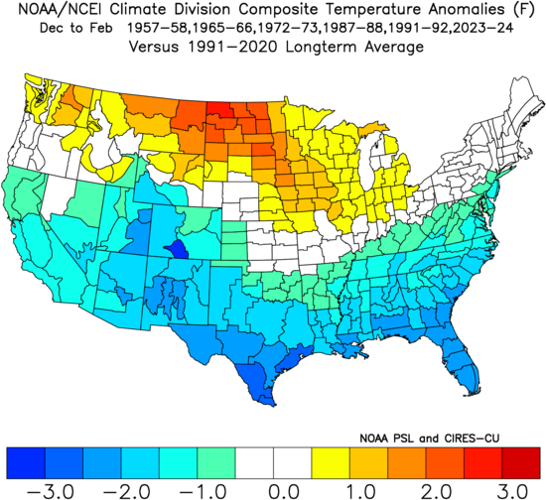
Temperature
While there's only 6 examples in the past of a strong El Nino, it's pretty apparent what history tells us. There's an obvious battle ground jet with below normal temperatures for the southern US, leaving us on that battle ground line/leaning to below normal temperatures.

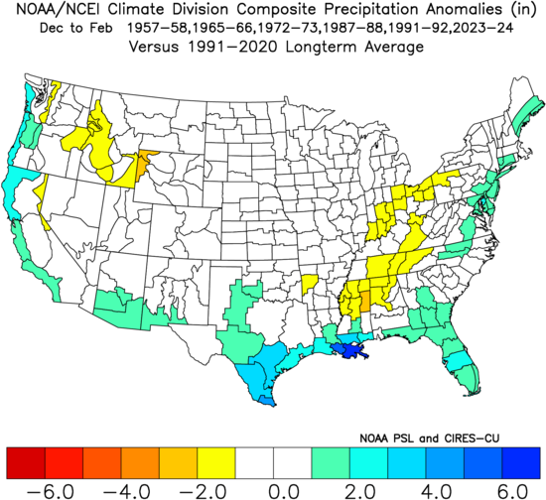
Precipitation
There's not really too much of a strong signal in either direction with "strong" El Nino's for our area in terms of above or below normal precipitation. While we may "lean" toward drier than normal, you can see we're still leveling out on that battle ground jet where it could go either way.

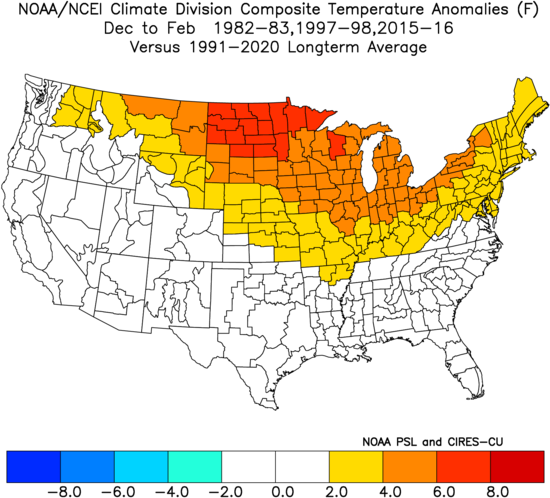
Winter "Very Strong"/"Super" El Nino For Our Area
Now let's talk about the rarer "very strong" El Nino for our area. Again, this sample size is even smaller with only 3 recorded events. Therefore, any extremes in both precipitation and temperature can heavily impact what is shown. That's why we take this data with even more of a grain of salt.
Temperature
Interestingly enough, and sort of contradicting the "strong" El Nino's, "very strong" El Nino's have shown above normal temperatures for much of the US, partially including our area and again leaving us closer to that battle ground jet that could go either way.
Precipitation
So what's it showing for precipitation? Very similar to the "strong" El Nino, there's not really a tell-tell sign for either direction for our area. When you go down to the deep south though, you can see the above normal precipitation begins to come up.

Summary
There is still a long way until we get to where an El Nino could form, but most signs are pointing to at least a moderate, if not strong or very strong, El Nino forming by the fall. There is currently an El Nino Watch out for that. It makes sense that in El Nino's in fall we typically see cooler than normal temperatures and slightly below normal rainfall because of how the warm Pacific affects the jet stream. It causes ridging on the west coast of the US, allowing for warmer air to roll in, and troughing on the eastern half of the US, allowing for cooler temperatures and a cutoff from the Gulf. While these aren't gospel, it can give us a good idea of what could be on the way toward the end of the year as we get closer to winter.


