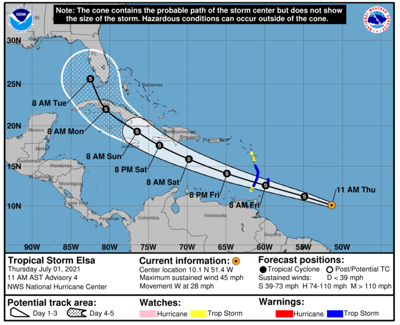
The cone of uncertainty has long been the method of showing where a hurricane is headed, but is there a better way? We have learned through social science research that the cone of uncertainty is not well understood by the general public. The biggest problem is the hard yes/no aspect of the cone. Many people think if they are outside the cone of uncertainty, there will be no impacts from the storm. That is not true. The National Hurricane Center says the cone of uncertainty only represents the potential forecast of the center of the storm, not of the outer bands of wind/rain/tornadoes/etc.
Researchers at Colorado State University have suggested an alternative to the cone of uncertainty which they have termed "zoomies." Personally, this is what I (Hannah) call it when my dog gets really hyper and randomly runs around the house for several minutes. But these "zoomies" show us there are other ways to communicate a hurricane forecast. CSU has a fantastic Atmospheric Science program, but this study came from the Department of Psychology.
The gif above shows the concept: instead of using a cone that grows wider the farther you are looking into the future, these moving dots will show the possible tracks of the hurricane. Since you can see the movement of the dots, your brain can form conclusions about where they are headed even after the loop ends. Would something like this help you better understand the track of the hurricane? Or do you prefer the cone? The one pictured below is an OLD image (not a current storm) from what became Hurricane Elsa.

The lead researchers on the Zoomies project specialize in visual understanding, so they are looking for the best way to present the same data in a way that your brain would draw the correct conclusion. Your "visual system" is already capable of summarizing information; it does so every day. The researchers then suggested, instead of summarizing ensemble data and spaghetti plots, why not give the viewer that raw data in a way that their visual system can make the summary instead. This would give the viewer a better understanding of the uncertainty involved in the forecast and the range of locations that could be impacted by getting rid of the hard edges of the cone of uncertainty.


