
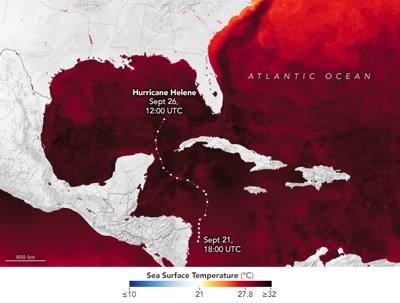

When tropical weather watchers in the U.S. began tracking a disturbance brewing near the Yucatan Peninsula in mid-September, there were already worrisome signs in ocean temperature data for the Gulf of Mexico and the Caribbean Sea.
Sea surface temperature and ocean heat content data—both derived from satellite observations—showed a tongue of unusually warm water extending north from the Caribbean Sea into the Gulf of Mexico toward the Florida Panhandle. It was a sign that the Loop Current—a variable current that shunts water from the Caribbean Sea into the Gulf of Mexico, around Florida, and up the eastern coast of the U.S.—had shed an eddy of warm water that was lingering uncomfortably close to U.S. shores.
Such features can make storms more dangerous because they provide a store of energy for passing hurricanes to draw from as they approach land, explained Scott Braun, a research meteorologist at NASA’s Goddard Space Flight Center. “These warm core eddies are a fairly persistent feature in the gulf and represent a deep layer of warm water that is much less likely to be disrupted by strong surface forcing by the hurricane winds,” he said.

Image Credit: NASA
The map above shows sea surface temperatures on September 23, based on data from the Multiscale Ultrahigh Resolution Sea Surface Temperature (MUR SST) project, a NASA Jet Propulsion Laboratory effort that blends measurements of sea surface temperatures from multiple NASA, NOAA, and international satellites, as well as ship and buoy observations. Surface waters above 27.8 degrees Celsius (82 degrees Fahrenheit)—the temperature generally required to sustain and intensify hurricanes—are represented in red on the map. The tongue of warm water is also visible in maps of sea surface temperature anomalies on NASA’s State of the Ocean data viewer.
“A warm ocean isn’t everything when it comes to hurricanes, but it’s a lot,” noted University of Miami hurricane researcher Brian McNoldy as the storm intensified near the Yucatan Peninsula. Not only were much of the seas along the storm’s path up to a “toasty” 31°C, but the warm water ran deep, fueling the storm with what McNoldy described as “a source of high-octane fuel.”

Image Credit: NASA
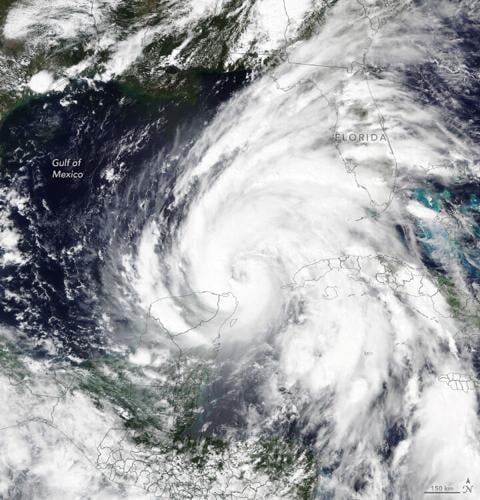
But ocean heat is just one among several factors that together control whether a hurricane intensifies rapidly or fizzles. In Helene’s case, the presence of high vertical wind shear, a patch of dry air on one side of the storm, and that only part of the storm hit the warmest part of the eddy likely helped constrain Helene’s intensity somewhat as it approached Florida. “If the track had gone right along the axis of the eddy, intensification would likely have been even greater,” Braun added. The image above, acquired by the VIIRS (Visible Infrared Imaging Radiometer Suite) sensor on the NOAA-20 satellite, shows Helene in the afternoon of September 25 as wind shear prevented the storm from developing a clear eye and becoming symmetrical.
Nevertheless, Helene underwent bouts of strengthening that met the official threshold for rapid intensification—an increase in the maximum sustained winds of a tropical cyclone of at least 30 knots (35 miles per hour) over a 24-hour period—as it neared Florida on September 25 and 26, fueling a major hurricane.
As Helene neared land on September 26, National Hurricane Center forecasters expected the storm to strike Florida’s Big Bend region as an unusually expansive, Category 3 or 4 storm that could deliver “catastrophic” storm surge and “life-threatening” flash and urban flooding. They warned that storm surges of 10 to 20 feet could swamp some areas, that hurricane-force winds could extend outward for up to 60 miles, and that total rainfall accumulations between 6 and 18 inches were possible. Since the storm was moving rapidly (more than 15 miles per hour), they cautioned that gusts could cause significant damage far inland, including portions of northern Florida, Georgia, and the Carolinas, after it made landfall.
Unfortunately, all of that happened as Helene made landfall at 11:10pm EDT September 26th in the Florida Big Bend region just east of the mouth of the Aucilla River. Maximum sustained winds at landfall were estimated at 140 mph with a minimum pressure of 938 mb.
11:20pm EDT 26th September -- #Hurricane #Helene has made landfall in the Florida Big Bend region at around 11:10pm EDT just E of the mouth of the Aucilla
— National Hurricane Center (@NHC_Atlantic) September 27, 2024
River.
Max sustained winds at landfall were estimated at 140 mph & a min pressure of 938 mb.
Info: https://t.co/1OTHyJkqja pic.twitter.com/WWohcTqpBa
NASA Earth Observatory images by Wanmei Liang, using data from the Multiscale Ultrahigh Resolution (MUR) project, VIIRS data from NASA EOSDIS LANCE, GIBS/Worldview, and the Joint Polar Satellite System (JPSS), and storm track data from NOAA's National Hurricane Center. Story by Adam Voiland.


