
Winter will officially be here before we know it and you know what that means...it's time to talk about snow. Some people can't get enough of it, while others would rather avoid it completely. How much snow do you want? We're going to answer that question as best we can given some of the variables that have emerged in recent months. When diving into the nitty gritty details of this year's winter outlook, it will be different than the last few years. So far, we've seen a lot of ups and downs this November, from near record high temperatures to a trace of snow on the 10th.
Normally, when we get good snows in this part of the Ohio Valley, it's a combination of cold air moving in from the north and moisture being pulled up from the south. With that in mind, we are still going to answer all of the obvious "need-to-know" questions that come with winter forecasting. Will it be warm or cold? How much snow if any will fall? You can always skip ahead to the end if you just want the summary. Look for the section titled "So, what do we think?"
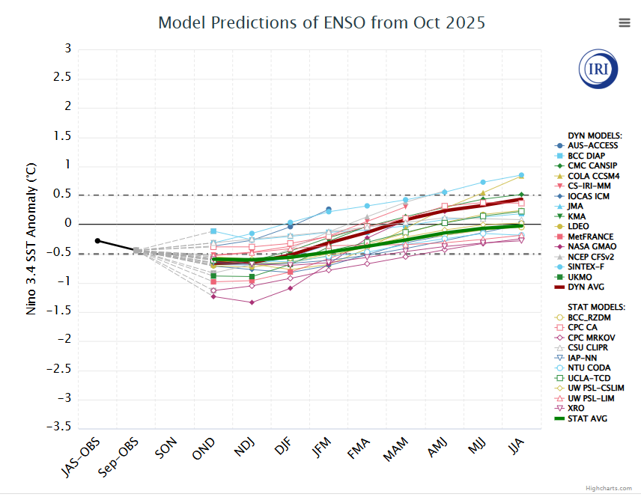
Ask any meteorologist, when it comes to putting together a winter outlook, the very first thing to investigate is the current state, as well as projected sea surface temperatures over the Eastern Equatorial Pacific known as ENSO. ENSO is one of the most important climate phenomena on Earth due to its ability to change the global atmospheric circulation, which in turn, influences temperature and precipitation across the globe.
Even though ENSO is a single climate phenomenon, it has three states, or phases, it can be in. The two opposite phases, “El Niño” and “La Niña,” refer to the warming and cooling of sea surface temperatures (SST), in the central and eastern tropical Pacific Ocean. Don’t forget about the third phase known as “Neutral” where tropical Pacific SSTs are generally close to average. Last winter season, we were in a "Neutral" phase, just for reference.
La Niña Current
Right now, a La Niña Advisory remains in effect which means current conditions are observed and expected to continue. Based on the latest forecast, that La Niña is expected to (at least 55% chance) transition to "Neutral" in January - March 2026.

Image credit: IRI
That could increase the likelihood of La Niña-related climate anomalies, specifically weak La Niña's. What are these anomalies I’m referring to? Well, that’s our next order of business. We use analogs, which is a historical instance of a given meteorological scenario or feature that is used for comparison with another scenario or feature. In a nutshell, this is a complicated way of saying history “can” repeat itself. It also important to note this is a tool we use to analyze possible temperature and precipitation outcomes, however, it’s no gospel. Let's take a look at temperatures and precipitation values for each month of the season during weak La Niña-Positive years.
WEAK LA NINA
TEMP: Equal Chance/Slightly Cooler Than Normal
First, what does "Equal Chance" mean? You'll hear us say this from time to time when it comes to the probability of something happening over time, whether that's temperature or precipitation in this case. Equal chance is used when the odds could swing either way and there is an equal probability of either one occurring. For example, if I were to say that we have an equal chance of having above normal snow or below normal snow, that would mean that there's an equal chance that either could occur. If you're a sports betting person, another good way to explain it would be saying if the spread between UofL vs UK football was even.
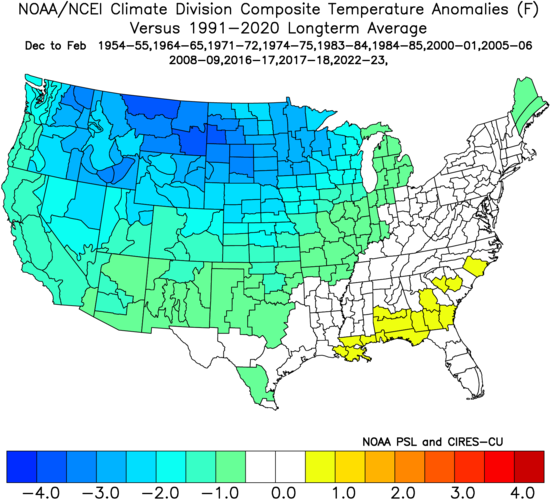
Keeping what "equal chance" means in mind, this analog above shows the difference in temperatures compared to average for all months of the season (Dec-Feb) during years that we had a weak La Nina in the US. What you'll notice is that for our area, most of us are right in the middle, meaning equal chance of warmer than normal compared to colder than normal. With that being said, there is definitely more note for cooler than normal conditions closer to our area just to our north and west than there is warmer than normal down near the Deep South and parts of the Carolinas.
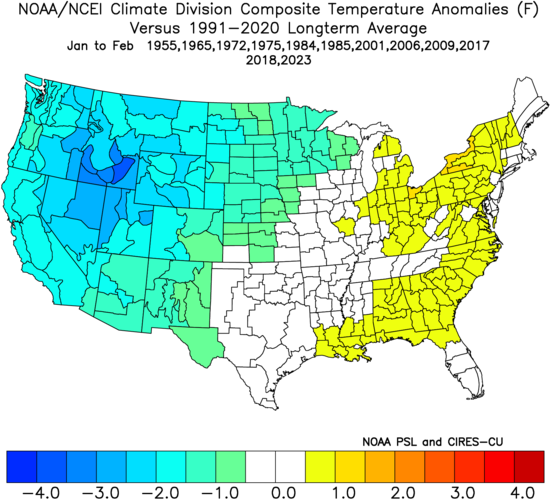
When we narrow down the data to just January and February, it appears that compared to other weak La Niña in our past, that we shift to a more mild-like pattern. It's not a huge shift toward warmer than normal like you can see toward the Deep South and into the Northeast, but it is definitely noticeable. It's more of a subtle change that could pull more warm down.
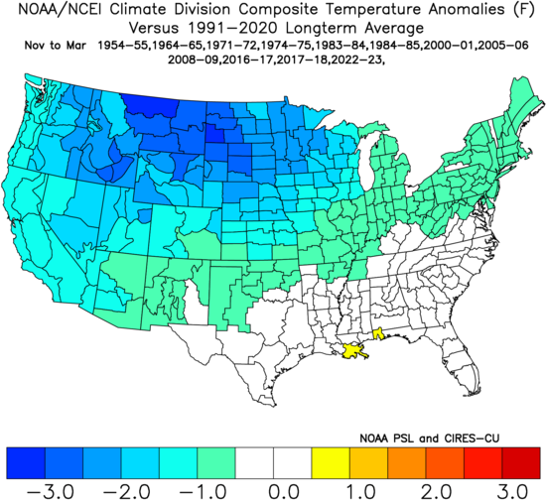
How about if we do all of the "cooler" months in our area compared to previous years with weak La Niñas, that being November, December, January, February, & March?

On this analog, again that takes into account the cooler months (Nov-Mar), the cooler than normal temperature anomalies definitely take control close to our area. It still isn't a slam dunk, but it obviously leans to slightly cooler than normal.
PRECIP: Slightly Above Normal
Now lets take a look at the same analogs for the same months for weak La Niña events, but for precipitation this time instead of temperatures. Don't forget, precipitation refers to all forms such as rain, not just snow.
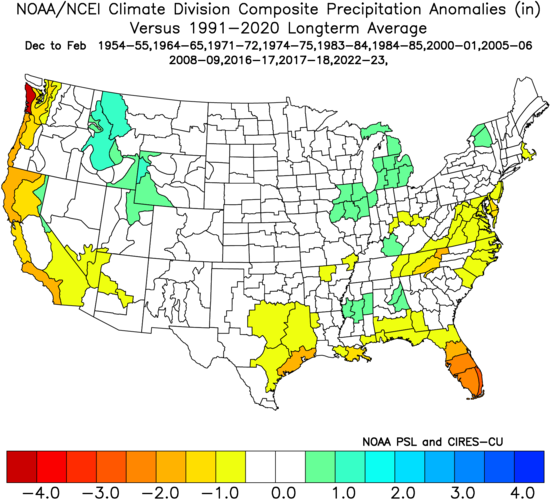
In the image above, we are looking at the entire winter season once again (Dec-Feb). You'll see that for much of the country, there really isn't much of a difference compared to normal in terms of precipitation, except for maybe the southern US seeing below normal precipitation. However, for our area, you'll also see our Kentucky counties lean toward wetter than normal, while some of our southern Indiana communities lean toward drier than normal. Odd, right? Now, let's take a look at January and February alone.
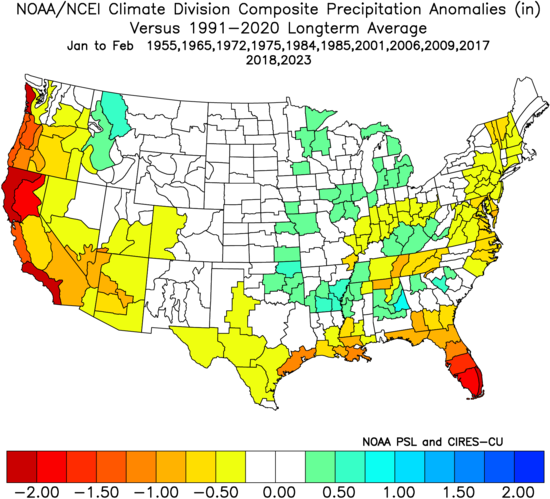
This graphic is where you'll start to see more of a difference. In January and February for weak La Niña events, our area leans more in the direction of wetter than normal in Kentucky and drier than normal conditions in Indiana.
Let's once again look at all the "cooler" months (Nov-Mar) for our area with the same criteria...
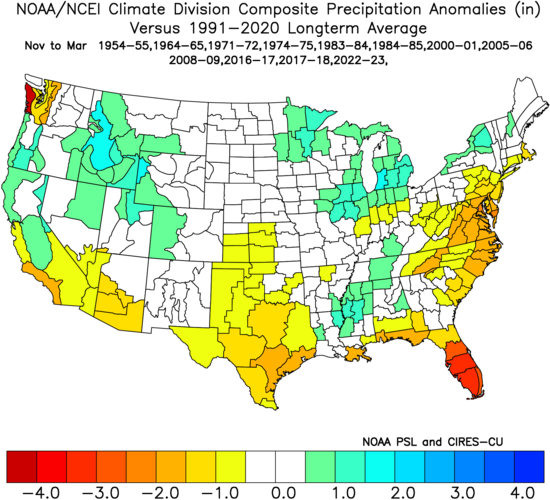
You'll notice some similarities with this analog for all month ranges here. The general consensus is that with weak La Niñas, our Kentucky counties have leaned toward wetter than normal to the south and drier than normal for Indiana communities to the north.
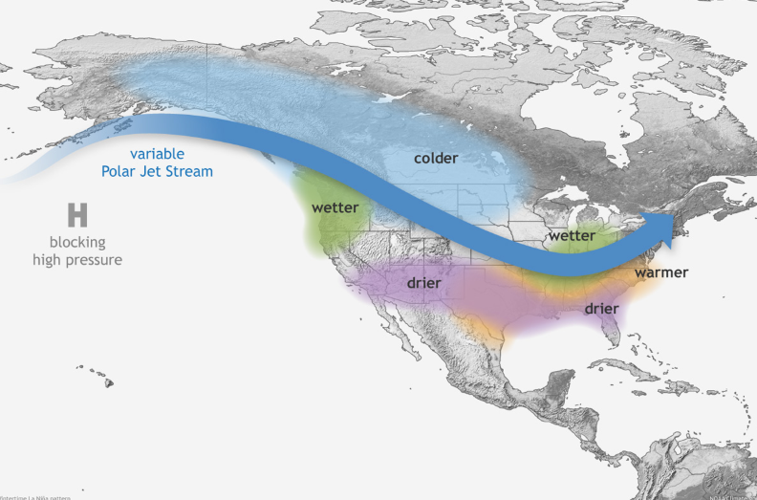
The main feature of a La Niña pattern is a wave-like jet stream flow across the US. This can cause colder and stormier conditions for the Northern US and warmer and less stormier conditions for the Southern US.

It is important to note though that this is a weak La Niña and not a strong one, so those descriptions can be helpful, but as we saw with what has happened in our area in the past with weak La Niñas and compare them to that map of what generally happens, it is no gospel.
Snow
Alright, now let's look at what a lot of you are interested in, snow! Since we are expecting a weak La Niña this season, we have compiled all of the previous years with weak La Niñas and their snow totals for the season! What we found is interesting. Take a good look at the table below, then we will explain more below it:
| Year | Amount (in) |
| 1954 | 7.5" |
| 1964 | 29.9" |
| 1971 | 15.9" |
| 1974 | 6.4" |
| 1983 | 5.1" |
| 1984 | 12.5" |
| 2000 | 11" |
| 2005 | 11.8" |
| 2008 | 9.3" |
| 2016 | 14.4" |
| 2017 | 2.7" |
| 2022 | 8" |
| Avg: | 11.2" |
What you'll notice from that chart is during those select years, there was a huge range of snowfall totals from 2.7” in 2017 to 29.9” in 1964! By taking the average of all those snow totals, we end up with 11.2” which is slightly below average. For reference, Louisville receives around 13.4” of snow on average each winter season.
Here's something that we found that was even more interesting! Those snow totals you just read were only from December, January, & February because that is the official "winter" season in meteorology. However as many of you know, we can get snow in early Spring and late Fall too! We found that in some years previously with a weak La Niña, we ended up getting a respectable amount of snow in early Spring and some in late Fall! Check this out!
| Year | Spring | Fall |
| 1954 | 0 | 0.9" |
| 1964 | 4.6" | 5.4" |
| 1971 | 1.2" | 1" |
| 1974 | 10" | 0 |
| 1983 | 1" | 0 |
| 1984 | 0 | 0 |
| 2000 | 0.2" | 0 |
| 2005 | 0 | 0 |
| 2008 | 0 | 0 |
| 2016 | 0 | 0 |
| 2017 | 13.1" | 0 |
| 2022 | 0 | 1.5" |
| Avg | 2.3" | 0.73" |
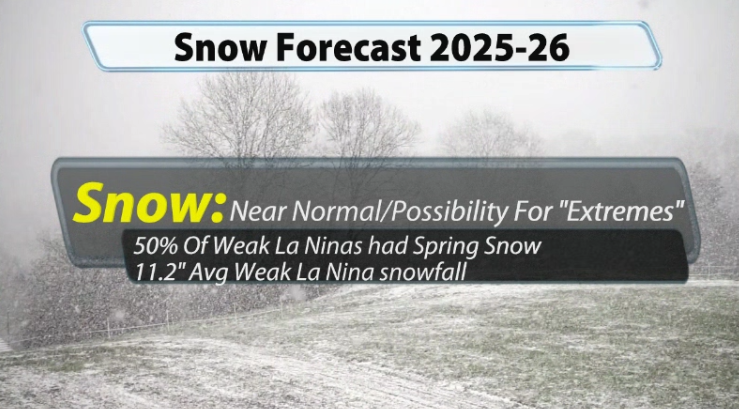
How wild is that? In previous weak La Niña years, 50% of them had snowfall in the Spring, and 33% of them did in the Fall. There are a lot of extremes there, with the spring of 1974 having 10" of snow and just a few years ago in 2017 having 13.1" of snow! The Fall snow totals see less "extremes", but still happened a number of times. Could this mean a spring snowfall this time around? History says it's about as even as a coin flip.
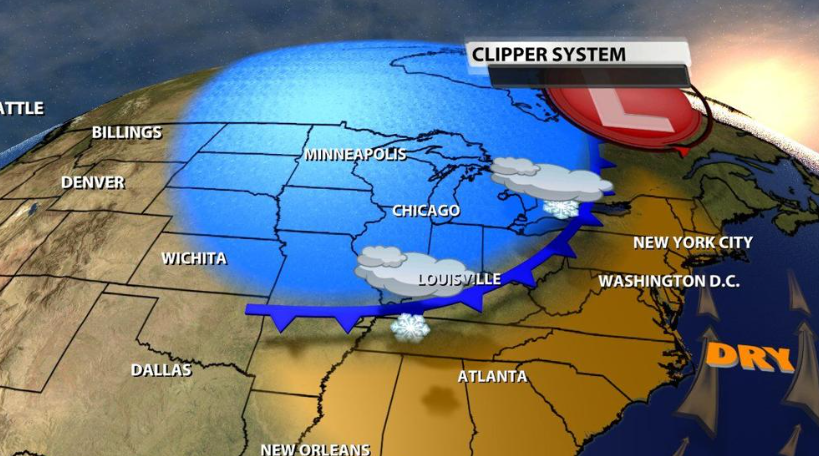
Clipper Systems
It's not very common for us to see absolutely no snow during the winter season. Often we will get a quick coating of snow overnight here or there. Why is that? Sometimes what causes the smaller snow amounts is because of what we call Alberta Clipper Systems, or just Clipper Systems. A clipper is a low pressure that moves Southeast out of Alberta (hence the name) and moves through the Plains and the Mid-West. While these systems are typically fast moving, and moisture-starved, we can get a quick fluffy, accumulating snow. Again, we can see several of these each year.
So, what do we think?
I want to begin by stating the obvious. Seasonal forecasts are not the most accurate thing we do because our weather models essentially become useless after 10 days out. For all snow lovers, the second half of the winter season usually has more potential due to the frequency of cold intrusions which could link up at the right time with moisture. This is all going to depend on the strength of our La Niña, which is something that we're going to be monitoring in the coming months.
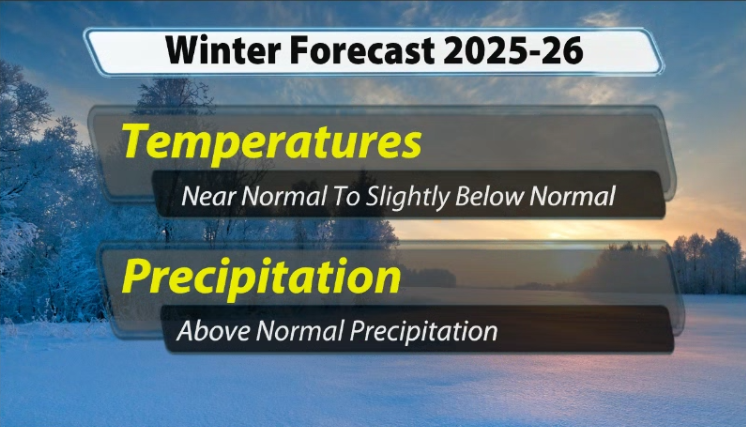
In regard to temperatures, we have medium confidence in a "near normal/slightly cooler than normal" winter by about 0-2 degrees. November has already shown us a trace of snow from a quick and early cold snap. December could end up being near or below average before we level the temperatures out a little more with a few extra cold spells into January and February. Next, we have high confidence in "above normal precipitation" and medium confidence in "near normal snowfall with the possibility of snow extremes".
In the past there have been different "Extremes" of snowfall that can sway the "average" for an event strongly one way or the other. This can and has happened before. When you look at some of the "extremes" of snow totals from previous weak La Niña years, those that stand out on opposite ends of the spectrum include 1964 when we received 29.9" of snow that year, compared to 2017 when we only saw 2.7" on the winter season. With that being said, based on history, I wouldn't be shocked to see an early "Spring" (typically in March) snowfall that could skew our numbers for the whole year. An early spring snow would be more likely it appears in a weak La Niña than a late Fall, but as we have already seen with the trace back on the 10th, it's not impossible.
What can cause these "extremes" with snow? When the energy from each jet phases and moves across the country, you have cold air and moisture needed to create snow. This can bring in very high snow totals. There are a lot of moving factors that have to come together at the same time for this to happen, which goes hand in hand to it being a cause of "extremes", but it isn't impossible. All it takes is one of these storms to roll in and cause major disruptions on the roadways for your commute to school and work.
Be sure to follow the entire WDRB Weather team on air and on our social media pages as we get into the winter season! You can download the WDRB Weather App now for free and always get up to date info on the forecast for the week. We will be watching this upcoming winter season so stay tuned!


