
The National Oceanic Atmospheric Administration (NOAA), National Weather Service, WFO New York, NY put together this comprehensive piece and it includes a must-see time-lapse video...
Event Overview
A nearly stationary low-pressure system near Maine and the Canadian Maritime Provinces brought persistent northerly winds from wildfires in Quebec, directing smoke into portions of the northeastern U.S. This affected the air quality for millions and resulted in an AQI (Air Quality Index) of very unhealthy and even hazardous in some areas. Visibility dropped as low as one half of a mile in places from Washington, D.C., to New York City. It is uncommon for visibility to drop so low due to smoke from wildfires located at such a great distance. The most significant near-surface smoke and poor air quality was observed on June 7th. Tens of millions of people were under air quality alerts from June 6th through June 7th, and the issuance of a dense smoke advisory was also needed across the near-shore waters.
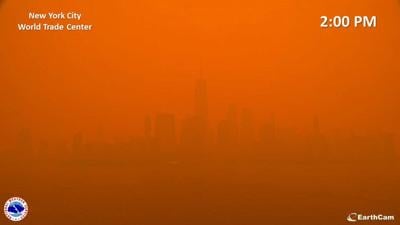
A time-lapse of the thickening plume of wildfire smoke over Lower Manhattan in New York City on the afternoon of June 7th 2023. Images courtesy of EarthCam
Satellite Imagery
There were several active wildfires ongoing across Southern Canada in the days prior to June 7th. The GOES-16 Fire Temperature RGB detected these fires on June 6th as seen in the below animation.
GOES-16 Fire Temperature RGB highlighting the active fires across southeast Canada on June 6th 2023. Imagery courtesy of CSU/CIRA/RAMMB
The smoke from the wildfires can be seen on GOES-16 GEOCOLOR imagery all across the northeast on June 6th. Building convective clouds developed in the afternoon, leading to localized severe weather across portions of Westchester and Northern Nassau County. Hail with diameters between 1.00 and 1.25 inches was observed with the severe thunderstorms. 1.00-1.25 inch diameter was observed with the severe thunderstorms. The low pressure can also be seen over the Canadian Maritimes helping to push the smoke southward due to its counter-clockwise rotation.
GOES-16 Geocolor satellite imagery from on June 6th, which shows a plethora of wildfire smoke over the Northeast. Imagery courtesy of CSU/CIRA/RAMMB
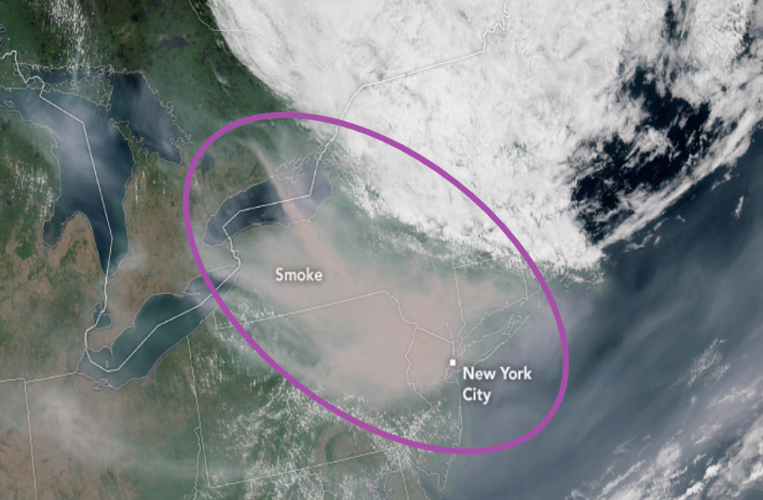
On June 7th, GOES-16 GEOCOLOR satellite imagery shows the widespread plumes of smoke across the northeast. A stalled low-pressure system near the Canadian Maritime Provinces with continued northerly flow over our region was responsible for the thick plethora of smoke that made its way through the Tri-State area. The thick plume is highlighted below within the purple circle.

GOES-16 GEOCOLOR on the afternoon June 7, 2023 depicting the smoke plumes originating in Canada. Imagery courtesy of CSU/CIRA/RAMMB
Meteorological Analysis
300 mb
A nearly stationary low-pressure aloft near the Canadian Maritimes brought persistent northerly winds from ongoing wildfires in Quebec. This low-pressure system even retrograded back to the west, which aided in trapping the smoke across the northeast. A jet streak is also centered around the spot of the wildfires which along with the northerly winds, helped carry the thick plume of wildfire smoke over our region.
500 mb
Similar features were observed at 500 mb which aided in the smoke plume advecting southeastward from Southern Canada to the northeast.
Surface
Surface analysis show high pressure giving way to a weak cold front passage across the area on the afternoon of June 6th. Behind this frontal passage, northerly flow was reinforced and strengthened allowing for transport of the wildfire smoke southeast over region through June 7th.
Sounding
Low-level thermodynamics likely played a role in trapping the smoke close to the surface rather than allowing it to disperse higher into the atmosphere. Below is a High Resolution Rapid Refresh (HRRR) SKEW-T analysis sounding valid at 2 PM EDT June 7, 2023. The green curve is the dew point and the red curve is the temperature. Winds are depicted in knots on the right side of the image. The highlighted layer of the atmosphere shows a subsidence inversion, or a region where temperatures are warming with height. Typically, temperatures decrease with height. The inversion helped trap the smoke below 10,000 ft. The temperature profile below the inversion is considered well-mixed and this likely led to the smoke actually descending to the surface and ultimately led to the poor air quality and visibility.
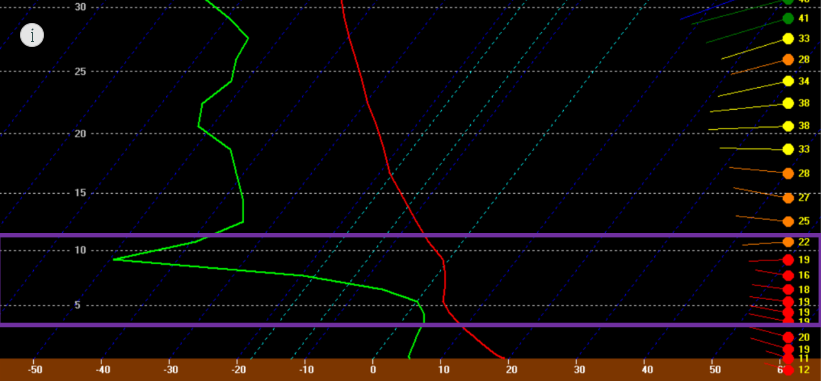
HRRR SKEW-T Analysis Valid at 2 PM EDT June 7, 2023.
Observed Surface Visibility
Observed surface visibilities across the northeast decreased on June 6th and got progressively lower with the thick smoke plume on June 7th. A normal visibility observation is 10 miles. The thick smoke lowered visibility to as one half to three quarters of a mile. This is unusual to observe such low visibility in wildfire smoke as low visibility is more typical during fog. Note: the NWS definition of dense fog is when the visibility is lowered to a quarter of a mile or less. The smoke was thick enough to bring visibilities close to what is considered dense fog across portions of the NYC metro area.
The interactive map below contains surface visibility observations from 8 PM EDT June 6, 2023 through 8 AM EDT June 8, 2023 from various NWS Automated Surface Observation Systems (ASOS) and Automated Weather Observing Systems (AWOS) across the region.
- Yellow balloon icons represent locations that observed a visibility as low as 4 miles.
- Orange balloon icons represent locations that observed a minimum visibility between 2 and 3 miles.
- Red balloon icons represent locations that observed a minimum visibility from 1 mile to 2 miles.
- Purple balloon icons represent locations that observed a visibility less than 1 mile.
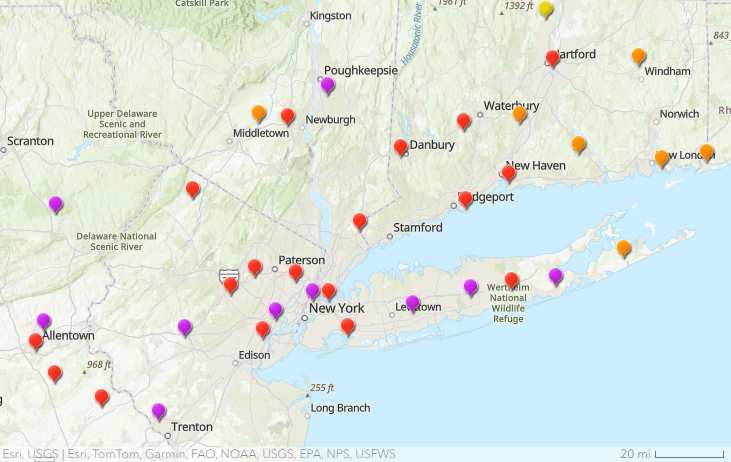
Observed Surface Visibility from NWS ASOS/AWOS from 8 AM EDT June 6, 2023 through 8 AM EDT June 8, 2023. Click on balloon icon for detailed observations. Yellow balloon icons represent locations that observed a visibility as low as 4 miles. Orange balloon icons represent locations that observed a minimum visibility from 2 miles to 3 miles. Red balloon icons represent locations that observed a minimum visibility from 1 mile to 2 miles. Purple balloon icons represent locations that observed a visibility less than 1 miles.
Air Quality
Air quality alerts were in effect for multiple days across the northeast. All air quality alerts were relayed by NWS New York, NY, but are issued by New York State Department of Environmental Conservation , New Jersey Department of Environmental Protection , and Connecticut Department of Energy and Environmental Protection . A large portion of the region under an Air Quality Alert on June 7th. The NWS New York, NY and Mt Holly, NY even issued a Dense Smoke Advisory for the New York Harbor Area.
Below are the local and national Watch/Warning/Advisory Map during the afternoon on June 7th. The grey shaded counties are all under air quality alerts. The waters closest to the shore are highlighted in yellow, which is the dense smoke advisory .


