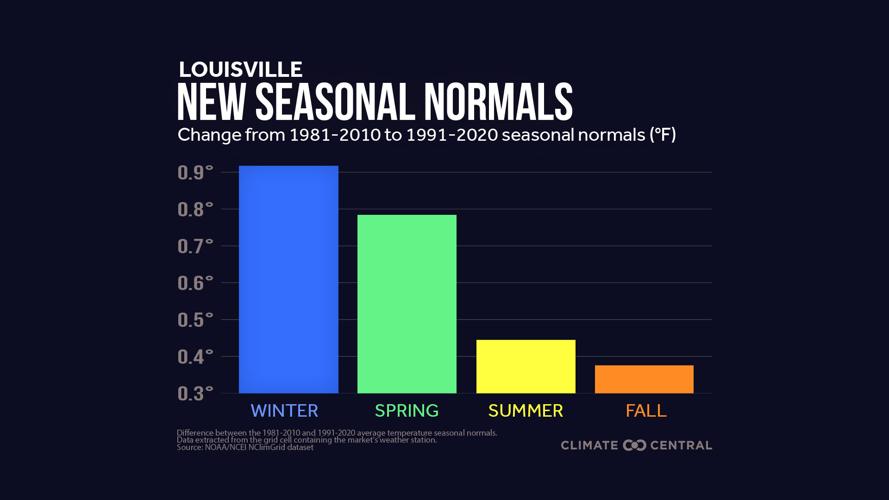

The weather is always changing. We know each day the weather will be slightly different, but if we look at that from the 30,000 foot level (metaphorically), you can see the weather in each season is changing, too. After the year 2020 wrapped up, scientists put together the new set of climatological normals. These numbers are based on data over the last 30 years to help us put in perspective what kind of weather (temperature and precipitation) is normal for this part of the world at this time of year. Comparing our new normals (1991-2020) to the old set (1981-2010), this data from Climate Central shows all four of our seasonal averages are slightly warmer. Fall saw a less than 0.4ºF increase while winter warmed more than twice as much and was clearly the season to see the most change.

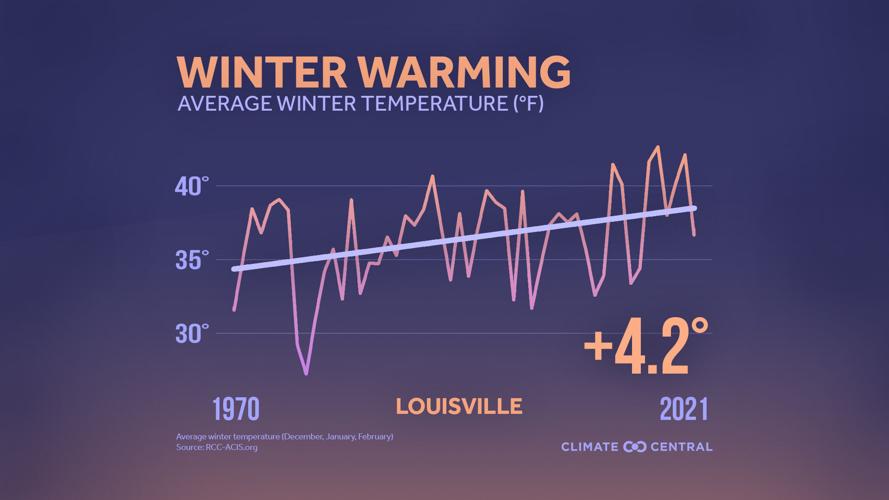
Over the last 50 years, Louisville's average temperature during the winter is up more than four degrees. That's not comparing daily high temperatures to each other; that's looking at what was the average temperature for the whole season December - February, and you can see the trend in the image below.

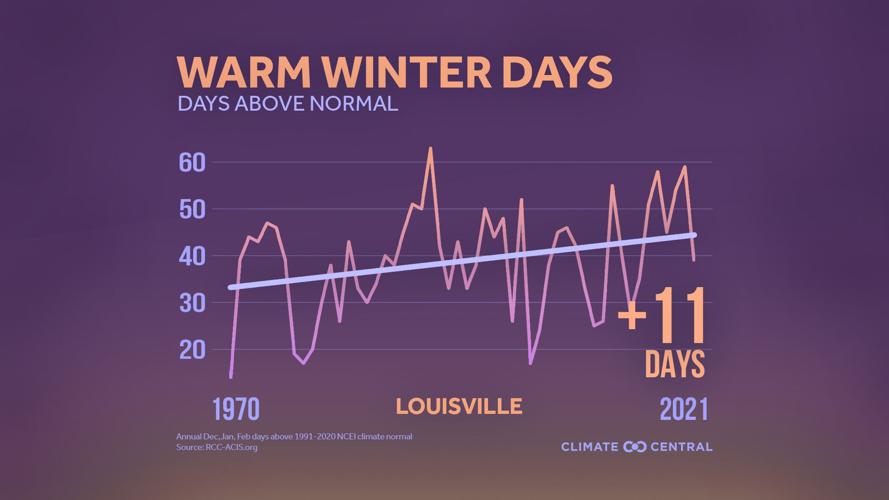
Part of that warmer average winter temperature comes from the fact that Louisville is seeing more days during the winter where the temperature was warmer than average. Again looking back statistically over the last 50 years, Louisville sees 11 more days each year with above average temperatures. Plus the graph below is using the newest (warmest) climate normals (1991-2020) to make those comparisons, so that warming would be even more significant compared to years past.

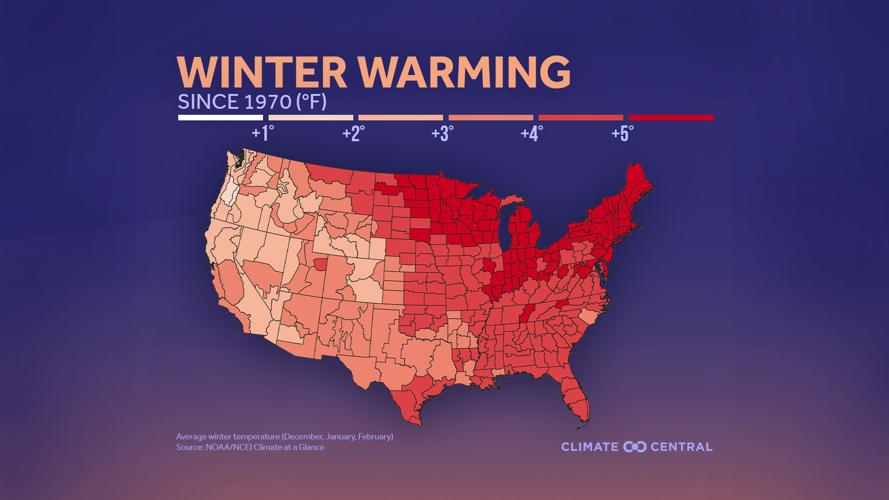
It's not just the Louisville area, though. The map below shows you how much the average winter temperature has changed across the country in the last 50 years. The north and east have seen the most significant warming according to this research by Climate Central.


